Overview Tab
The overview tab is where you can view statistics and metrics associated with the currently open Alarms across your Fleet.
This can be viewed at Fleet level (i.e., all Sites within the Organization), or at single Site level by using the drop down.
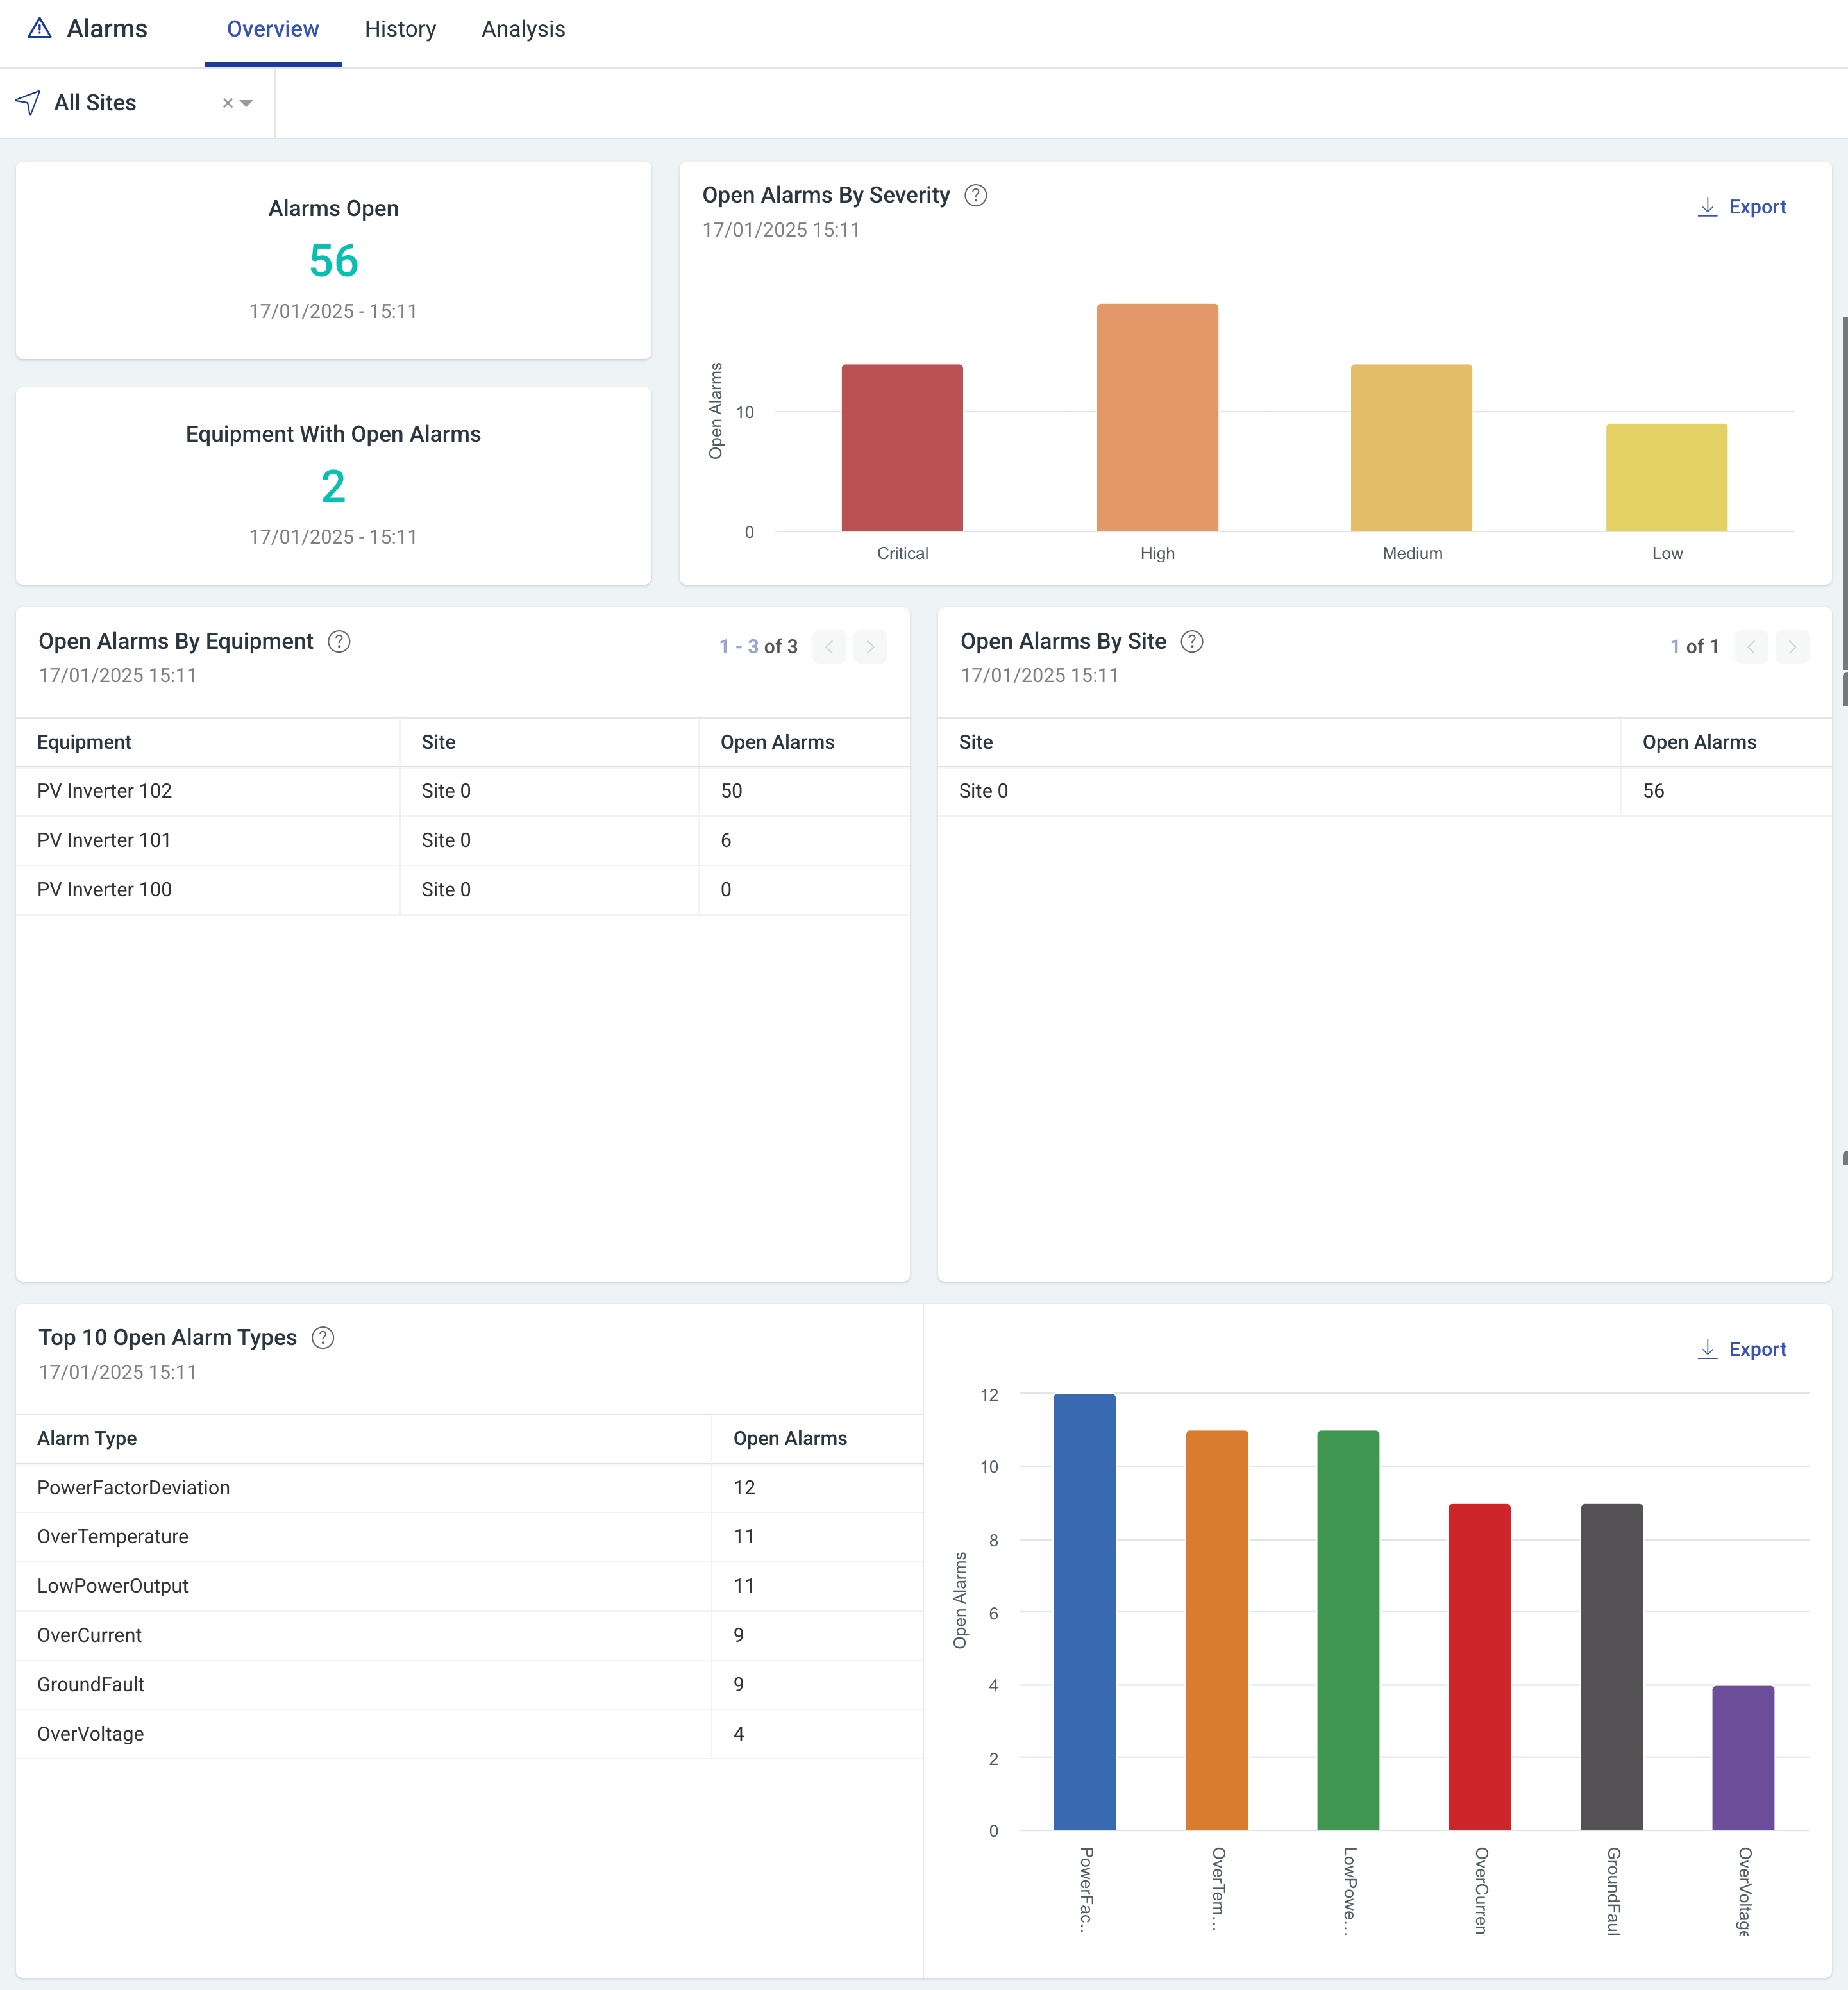
The top bar on the page shows some general summary statistics for Open Alarms:
- Open Alarms - This is the number of Alarms that are currently open across the selected Sites. The date/time below shows when this number was last updated.
- Equipment with Open Alarms - This is the number of unique pieces of Equipment that have Alarms open (i.e., "Inverter_01" might have 3 Alarms open but it will only be counted once in this list). The date/time below shows when this number was last updated.
- Open Alarms By Severity - This graph shows a breakdown of the severities of your currently open Alarms, ranging from Critical to Low. Hovering over a bar will show the number of Alarms open of that severity. This graph can also be exported in image or data format.
Beneath these summary statistics are more detailed tables, which show:
Open Alarms by Equipment - This table shows a list of Equipment with the number of currently open Alarms against them. The table is ranked from highest to lowest, so you'll be able to see clearly which is your most "problematic" Equipment.
Open Alarms by Site - Similar to the table above, this table shows a list of Sites with the number of currently open Alarms against them, so you can see which are your most "problematic" Sites.
Note: if you have applied a Site filter, the Site table will be hidden as there is only one Site selected.
Top 10 Open Alarm Types - A table which shows, of all of your currently open Alarms, which are the most commonly occurring types.