Aggregated Sites Consumption Comparison Report
Data Selection in the Aggregated Site Consumption Comparison Report Template
The Aggregated Site’s Consumption Comparison Report Template allows users to select a site and energy type in order to create a report that shows an aggregate of all meter readings at the selected site(s) across two selected date ranges. The data source and entry fields are:
- Name - The custom Report Name that will appear in the Report Management table.
- Energy Type - The type of energy that will be reported on, which could be either gas, electricity, heat, or steam. (Please note, you can only select one Energy Type at a time)
- Site - The individual Site where the relevant meter data will be collated and analysed
- Period A - The initial reporting period that Period B will be compared to.
- Period B - The subsequent reporting period that will be compared to Period A.
The time period that is selected in Period A or Period B will affect the comparison percentage in the report output. For example, if Period A is set to 2022, and Period B is set to 2021, the percentage change will be different than if Period A is set to 2021, and Period B is set to 2022. The kWh unit will remain the same.
Please note that the date ranges currently need to be in the past, regardless if it’s for Period A or Period B.
The Aggregated Site Consumption Comparison Report Output
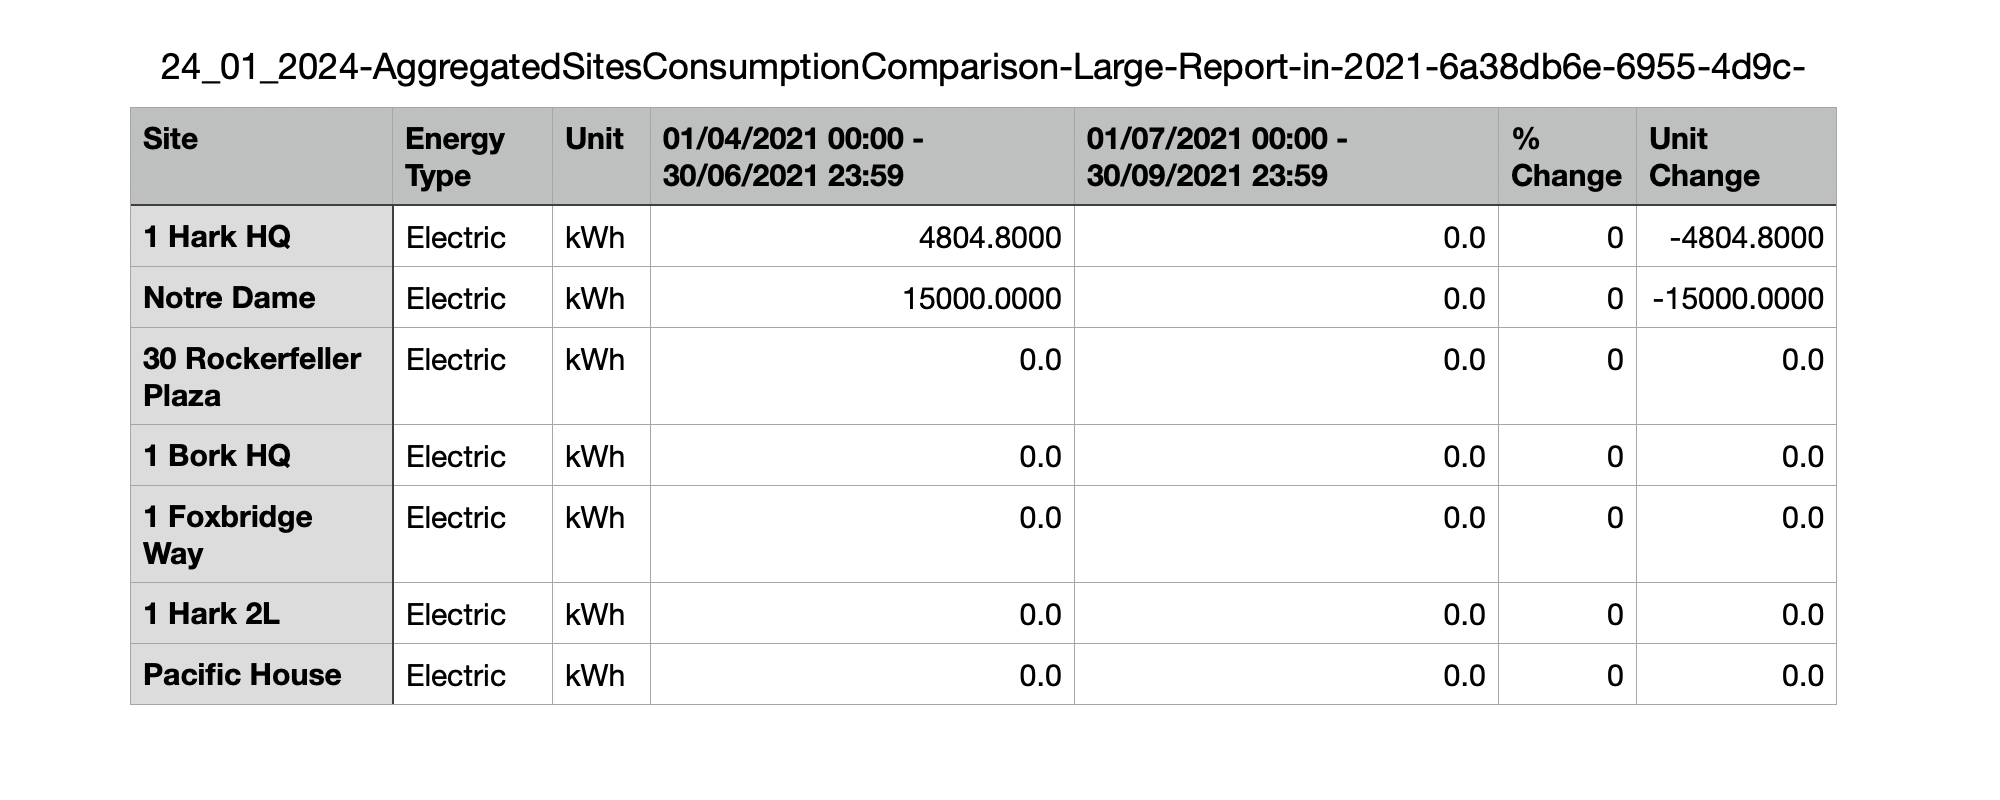
The Aggregated Site’s Consumption Comparison Report contains the following columns for each row, where each row represents a single site. The columns are below:
- Site - The individual Site where the relevant meter data will be collated and analysed
- Energy Type - The type of energy that will be reported on, which could be either gas, electricity, heat, or steam. (Please note, you can only select one Energy Type at a time)
- Unit - the unit of measurement for the aggregated readings
- Period A - displayed as (DD/MM/YYYY hh:mm - DD/MM/YYYY hh:mm) - The initial reporting period that Period B will be compared to.
- Period B - displayed as (DD/MM/YYYY hh:mm - DD/MM/YYYY hh:mm) - The subsequent reporting period that will be compared to Period A.
- % Change - The percentage change in consumption between periods.
- Unit Change - The numerical difference in value between periods.
The file name for the report will be in this format:
DD_MM_YYYY-[Report Template Name]-[Report Name].format
For example:
31_01_2024-AggregatedSiteConsumptionComparison-Test Report.csv