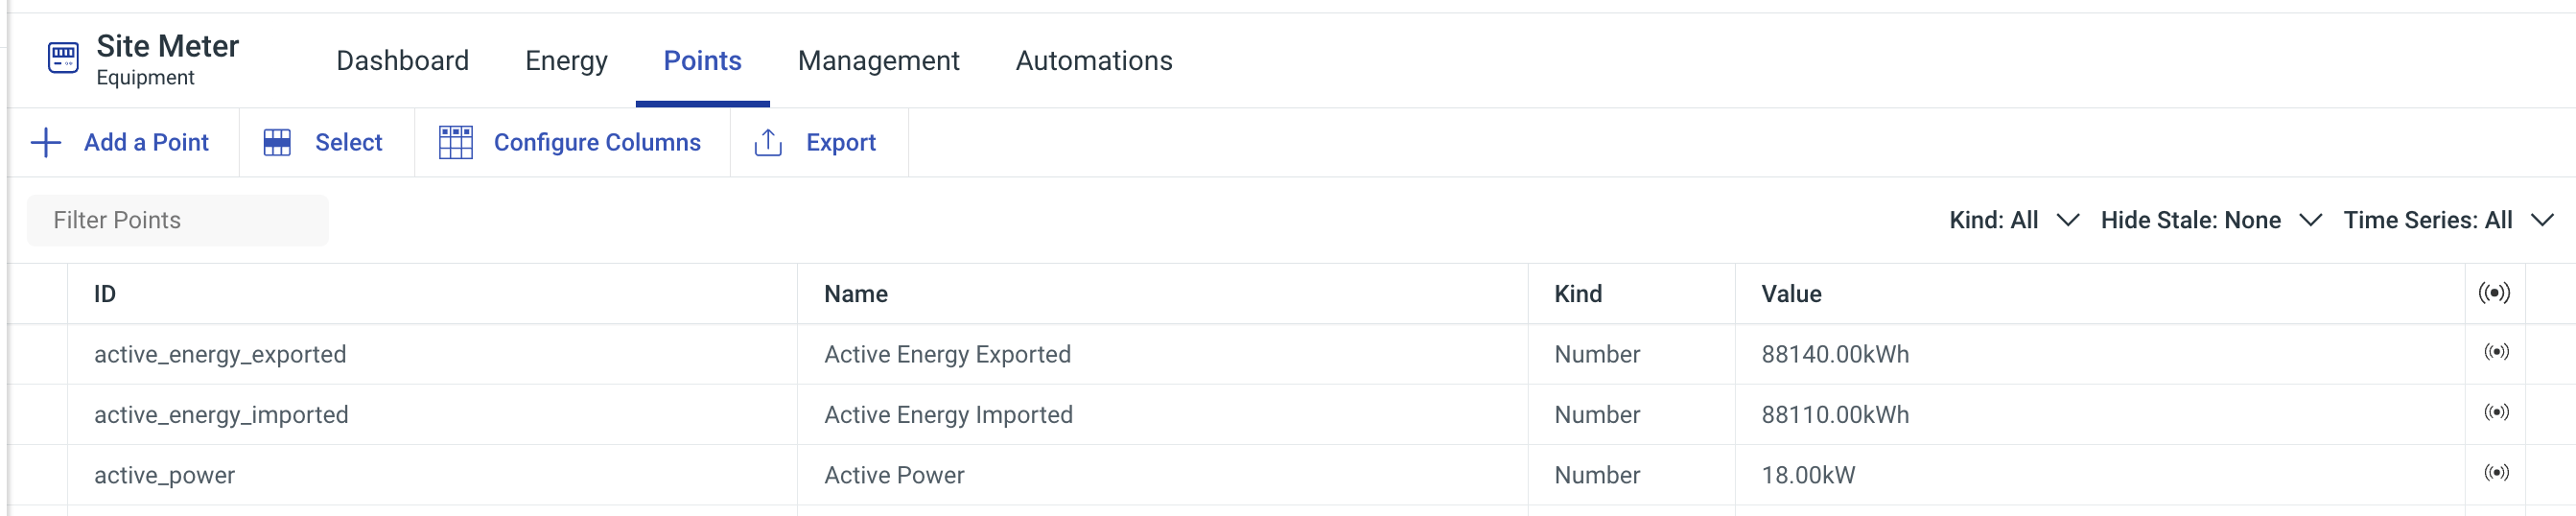
Points Tab
The 'Points' tab shows all the relevant Points associated to that piece of Equipment.
You can see a breakdown of the Points in a table that includes
ID: The Point ID
Name: The custom name given to the Point when it was added
Kind: If the Point is number, boolean or string.
Value: The value of the Point, like kWh, kW, etc.
Last Updated: When the latest value of the Point was received in HH:MM, DD Month Year
You can also alter what is in this table by using the "Configure Columns" button to add or remove columns.
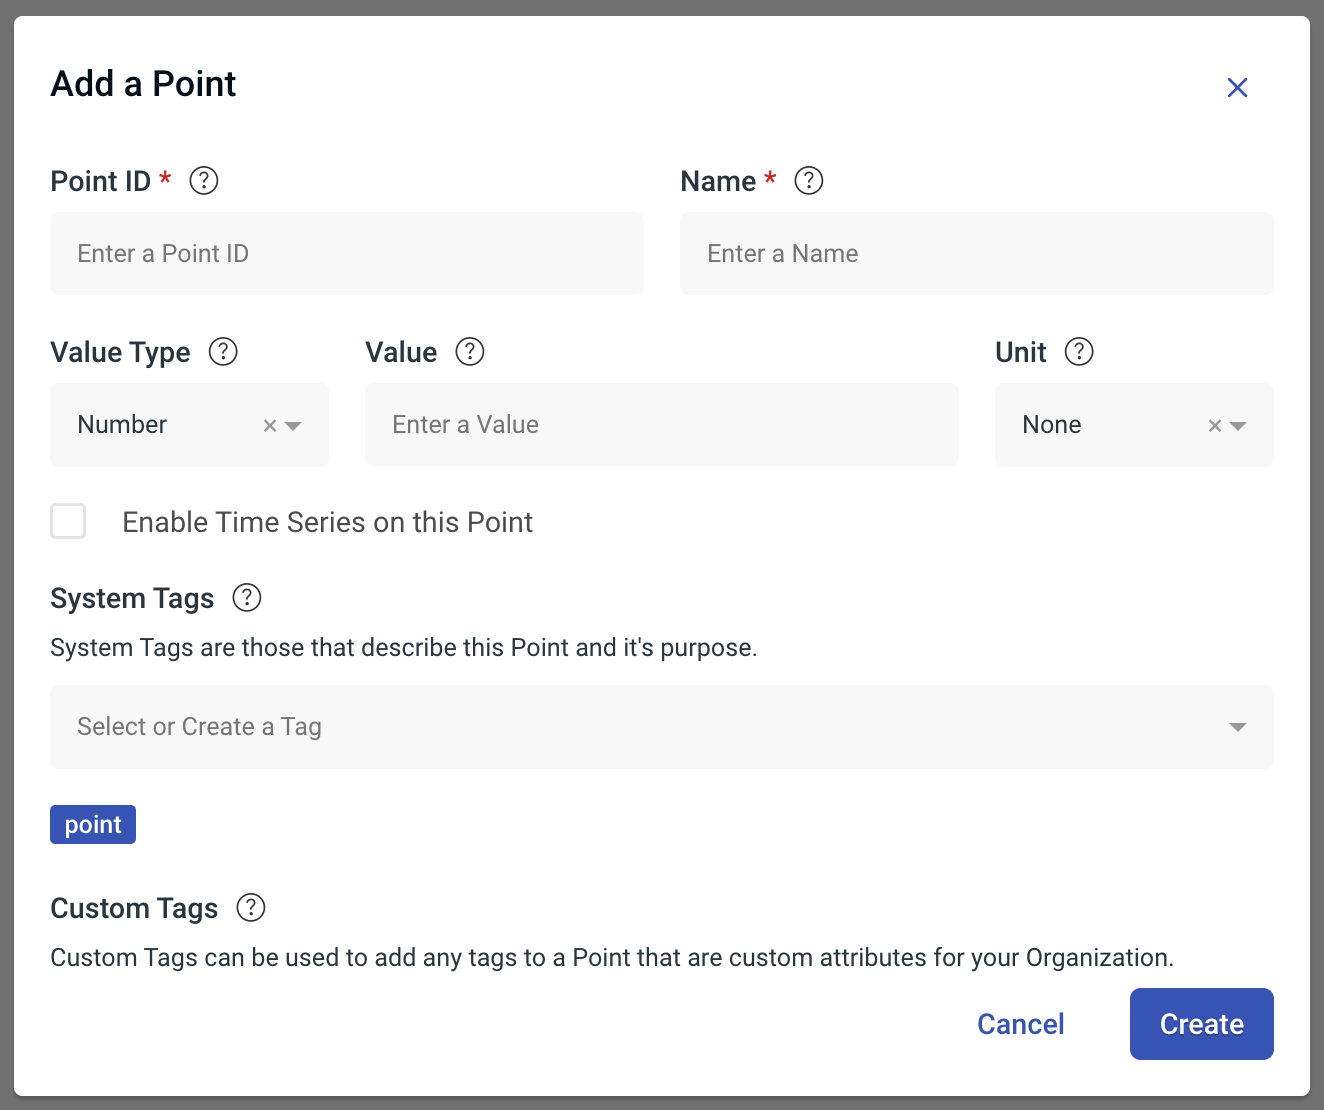
Adding a Point
To add a new Point to an Equipment, click "Add a Point" to see a pop-up that requests:
Point ID
Name
Value Type
Value
Unit
Enable Time Series on this Point
Tags
Once the information is entered into the relevant fields, you can click "Create" to add it to the Points table.
Deleting a Point
To delete a Point, you can either hover over Point row in the table to enable the bin icon, or you can click "Select" to multi-select and delete multiple Points.

Viewing a Point
On the "Points' tab, if you click on a Point from the table, it will take you to the Point's Overview page, which includes:
Value: The Point's current value
Last Updated: When the Point was last updated (HH:MM, Day Month Year)
Last Changed: When the Point was last changed, as some Points are counting and some are not (HH:MM, Day Month Year)
If the Point is time series enabled there will be a graph that shows the value of the Point, depending on what this Point is. For example, a kWh for an Active Energy Imported Point should be counting up and increasing.
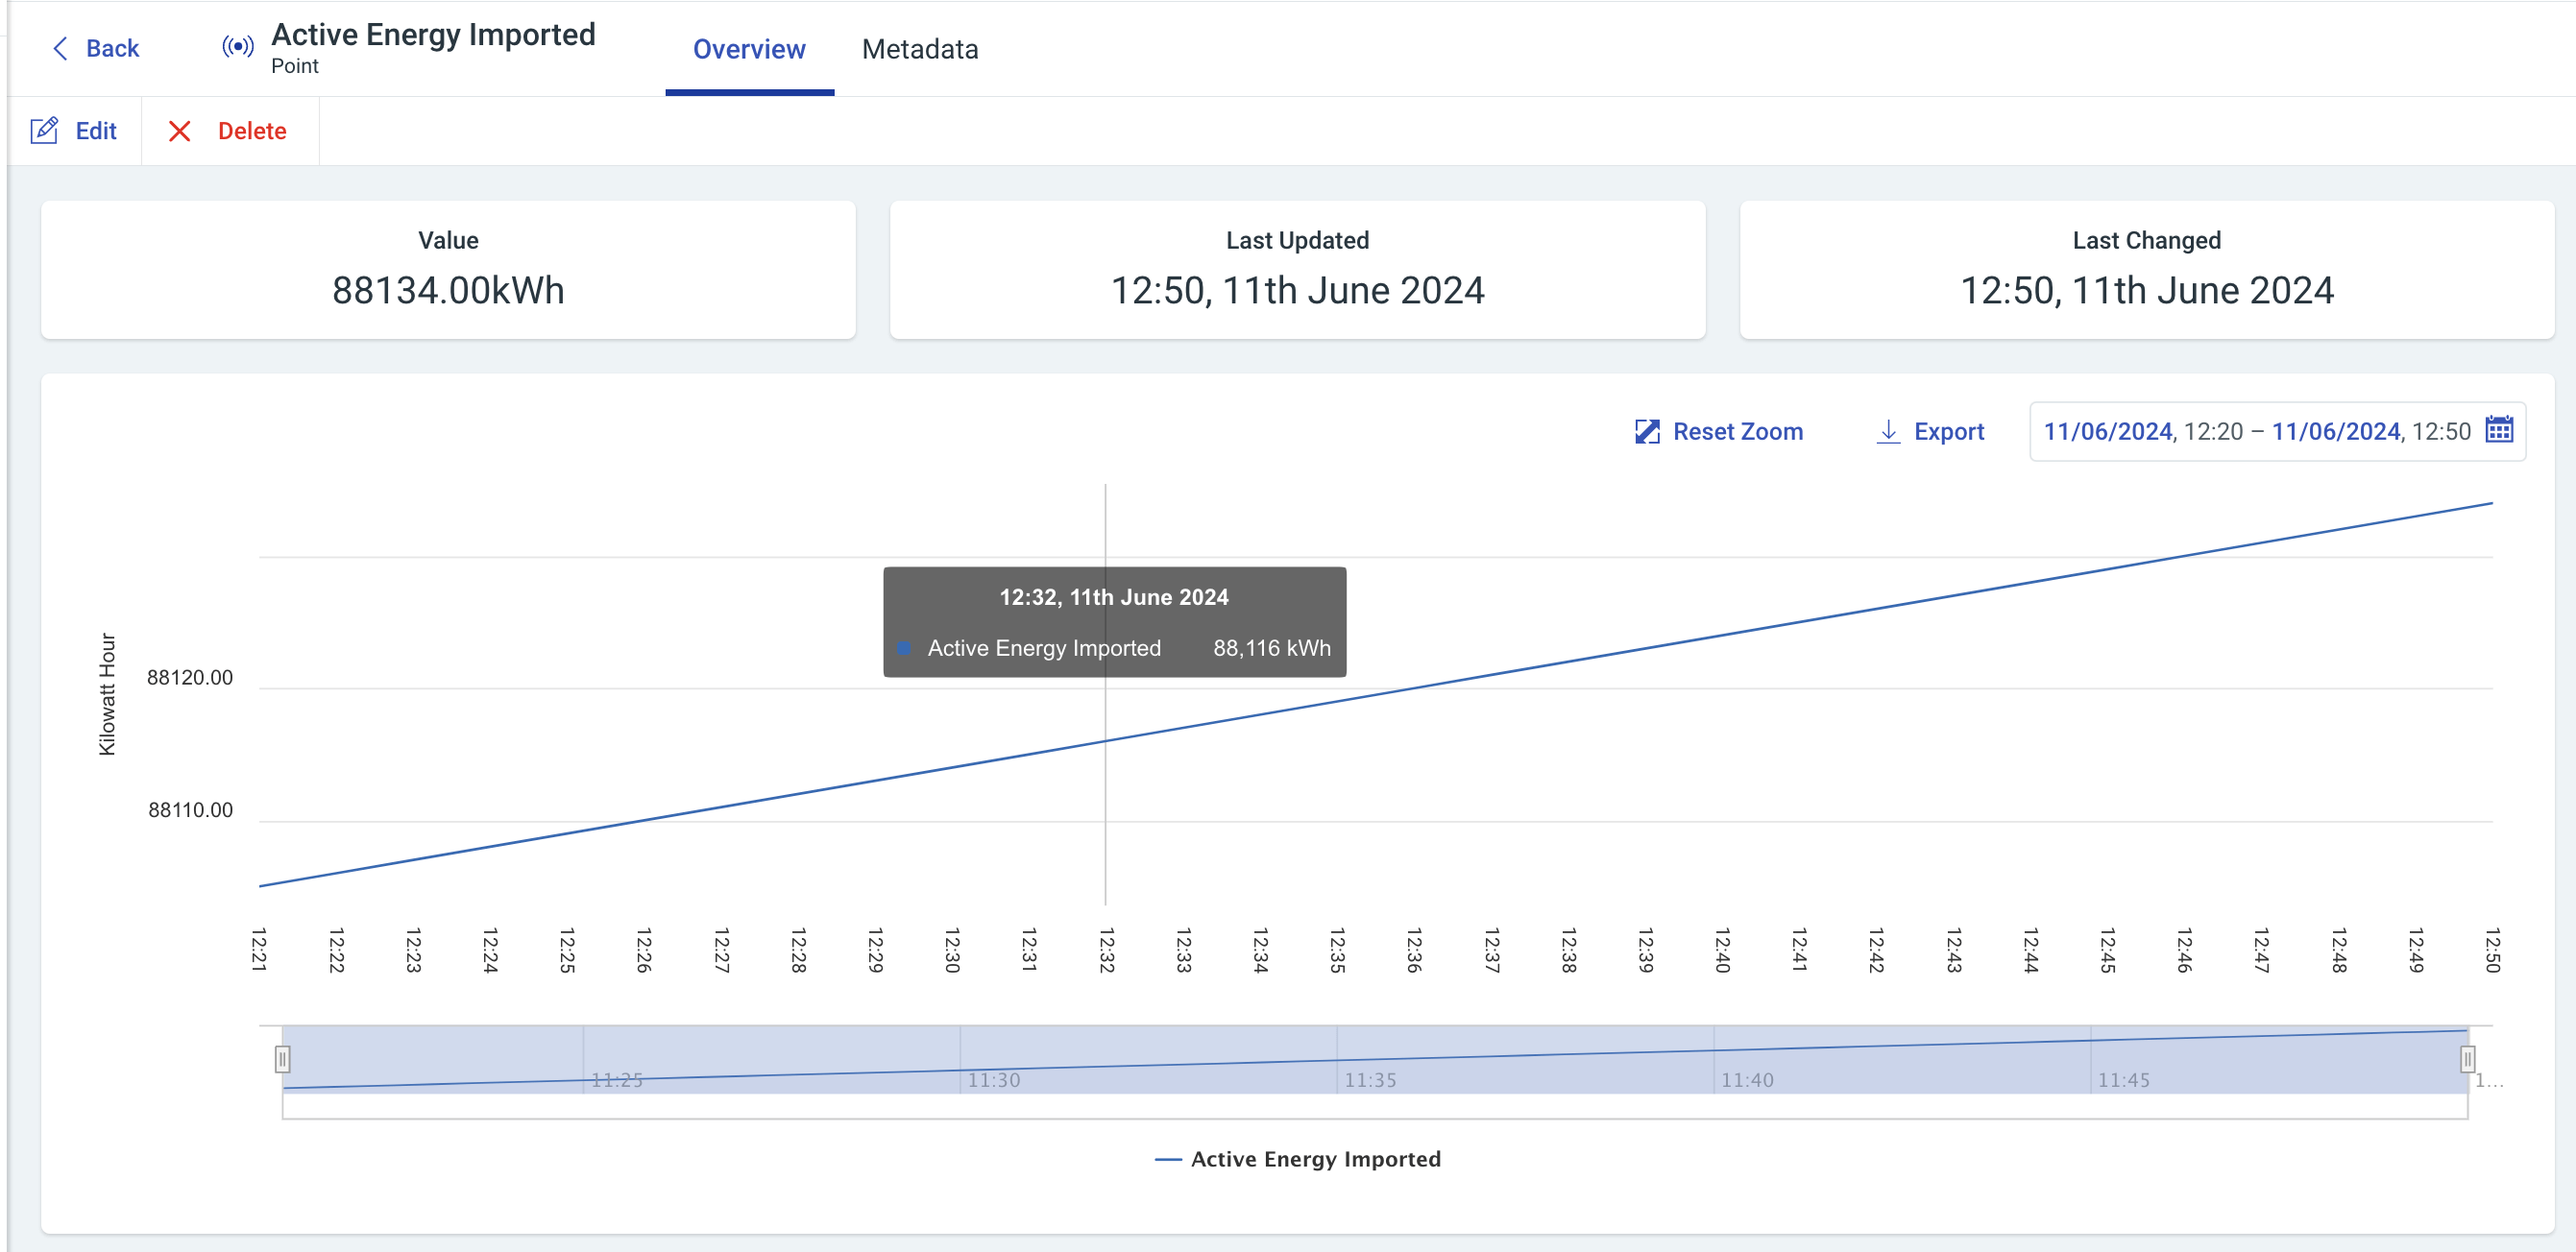
This graph can be zoomed in/out, depending on the selected date range using the Date Range Selector. The Periods are as follows:
Custom (User selected)
Last 30 Minutes (Default)
Last 60 Minutes
Last 3 Hours
Last 6 Hours
Last 12 Hours
Last 24 Hours
Last 1 Month
You can also export the graph by clicking "Export".