Electricity Meter Overview
When viewing a piece of Equipment configured as an Electricity Meter in the Explorer Hierarchy, you are presented with a tab labelled Energy
This guide will describe the various information, metrics and charts available on the Energy tab.
Summary
The Summary section contains the following:
Equipment Details
- Equipment Name: The user defined name of the Equipment.
- Equipment Type: The type of the Equipment, determined by its tags.
- Tags: The system and user defined tags for the Equipment; only tags relevant to Electricity Meter are shown. Other tags can be viewed by hovering the
+(n)tag, if present.
Electrircity Meter Summary
- Active Power: The most recent active power value for the Electricity Meter, including the date and time it was last updated.
- Energy Consumed: The amount of energy consumed by the meter today in kWh.
- Energy Exported: The amount of energy exported by the meter today in kWh.

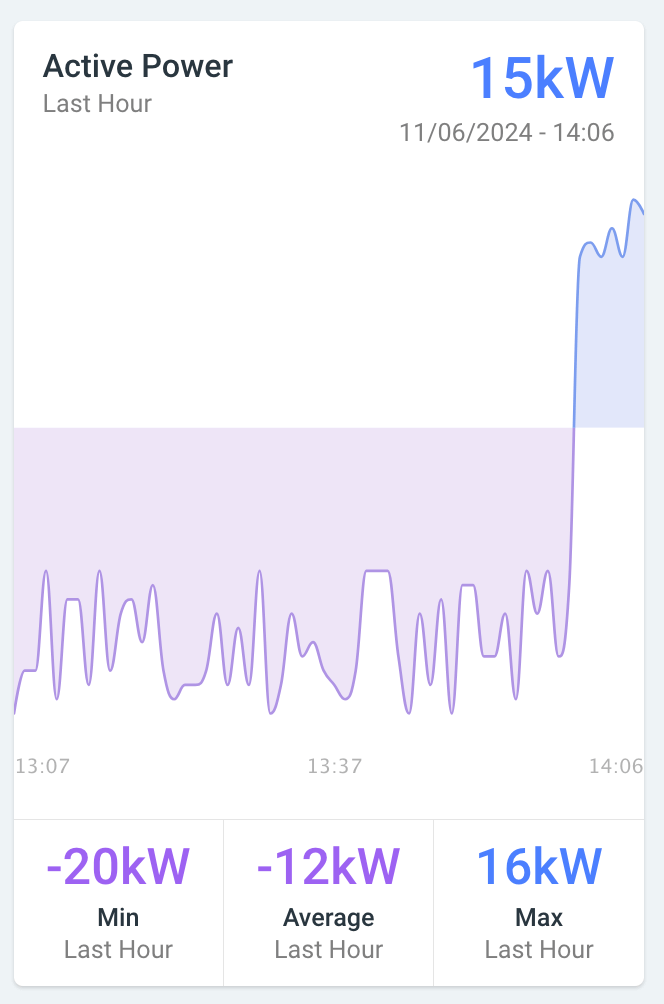
Active Power
Below the summary, is a more detailed visualization of the electricity meter's active power. It shows total import (blue) and export (purple) for the last hour as well as minimum, average, and maximum values for that period, and a chart that breaks down the period by minutely intervals.
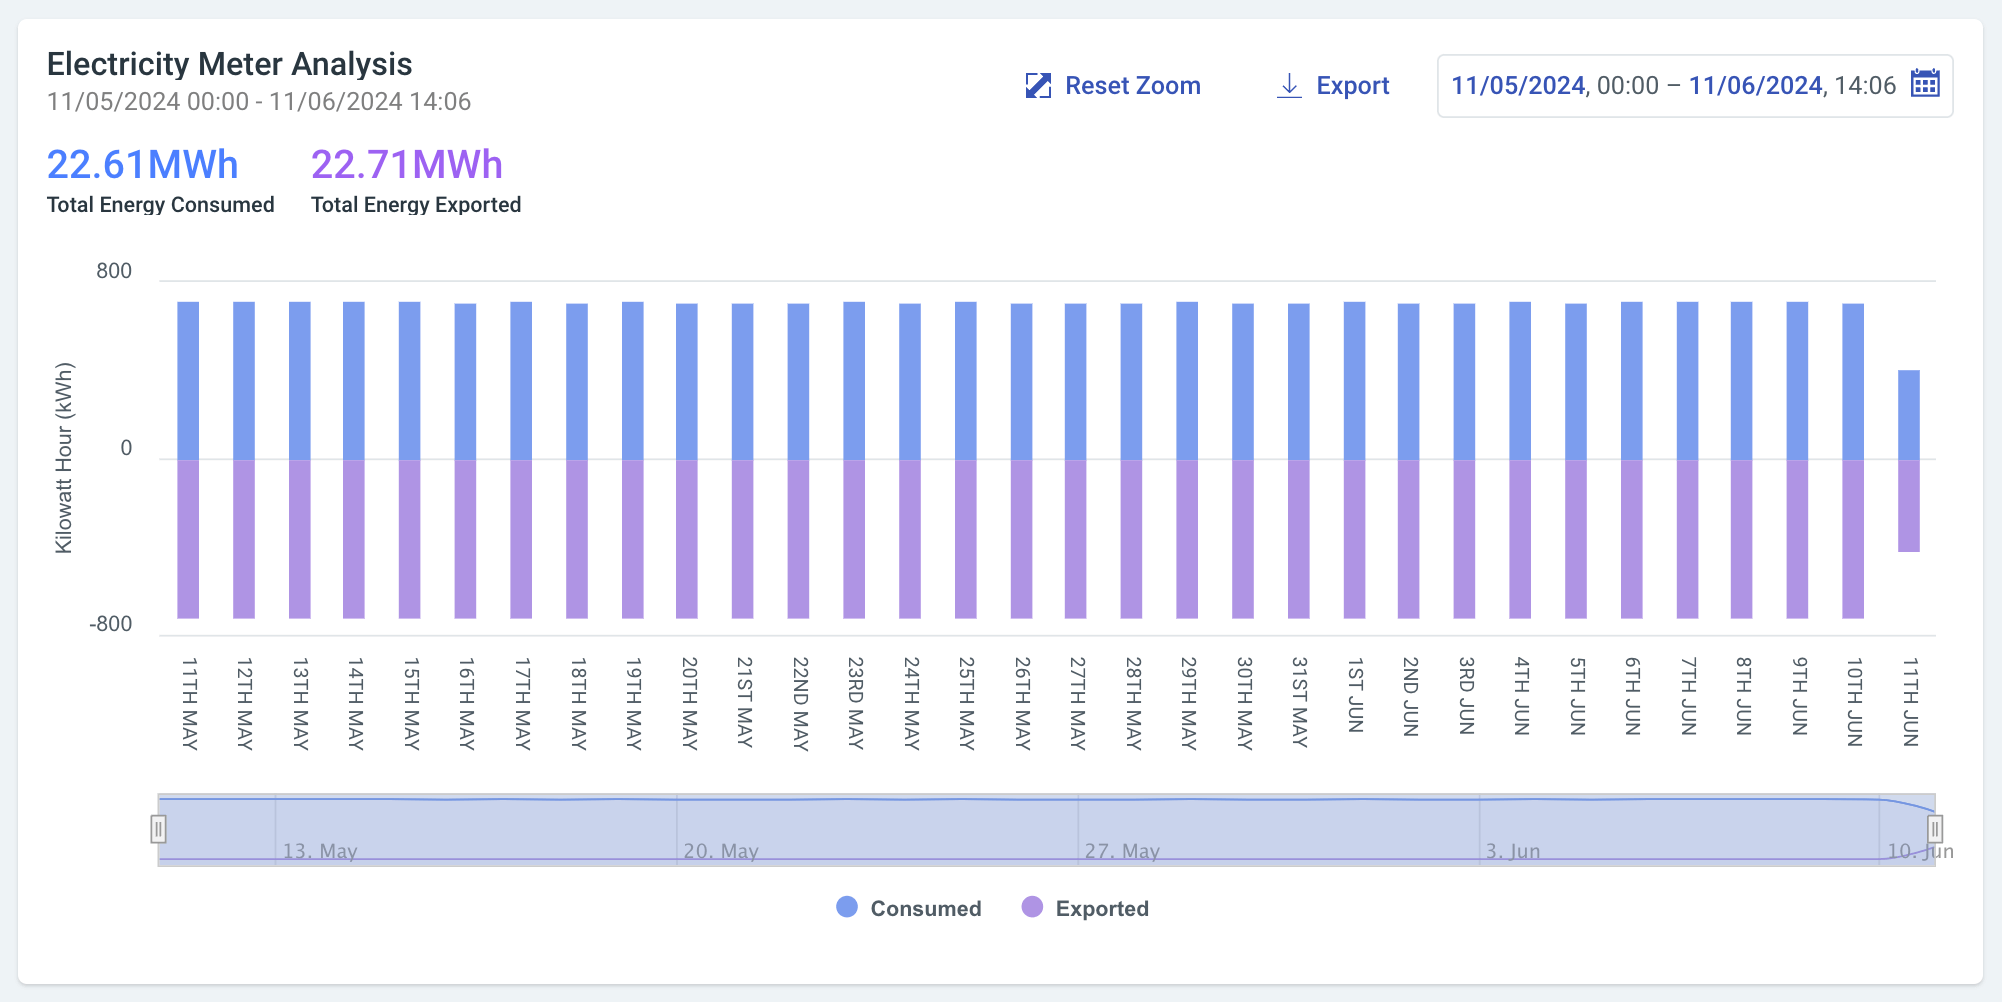
Electricity Meter Analysis
This chart shows the consumption of the Electricity Meter over time. By default it will show this information over the last 31 days at daily intervals. To view this information over a specific time period and interval, you can use the date range picker on the graph.
You can zoom-in on a range within the current period by dragging out a rectangle in the chart or by adjusting the handles in the navigator below.
To help with your external analysis, the graph can be exported as a visual or as raw data using the 'Export' button. You can also toggle the Consumed and Exported series data on the graph by clicking on the legend.