PV Insights
When viewing a piece of Equipment configured as a PV Inverter in the Explorer Hierarchy, you are presented with a tab labelled PV Insights.
This guide will describe the various information, metrics and charts available on the PV Insights tab.
Summary
The Summary section contains the following:
Equipment Details
- Equipment Name: The user defined name of the Equipment.
- Equipment Type: The type of the Equipment, determined by its tags.
- Tags: The system and user defined tags for the Equipment; only tags relevant to PV Inverters are shown. Other tags can be viewed by hovering the
+(n)tag, if present.
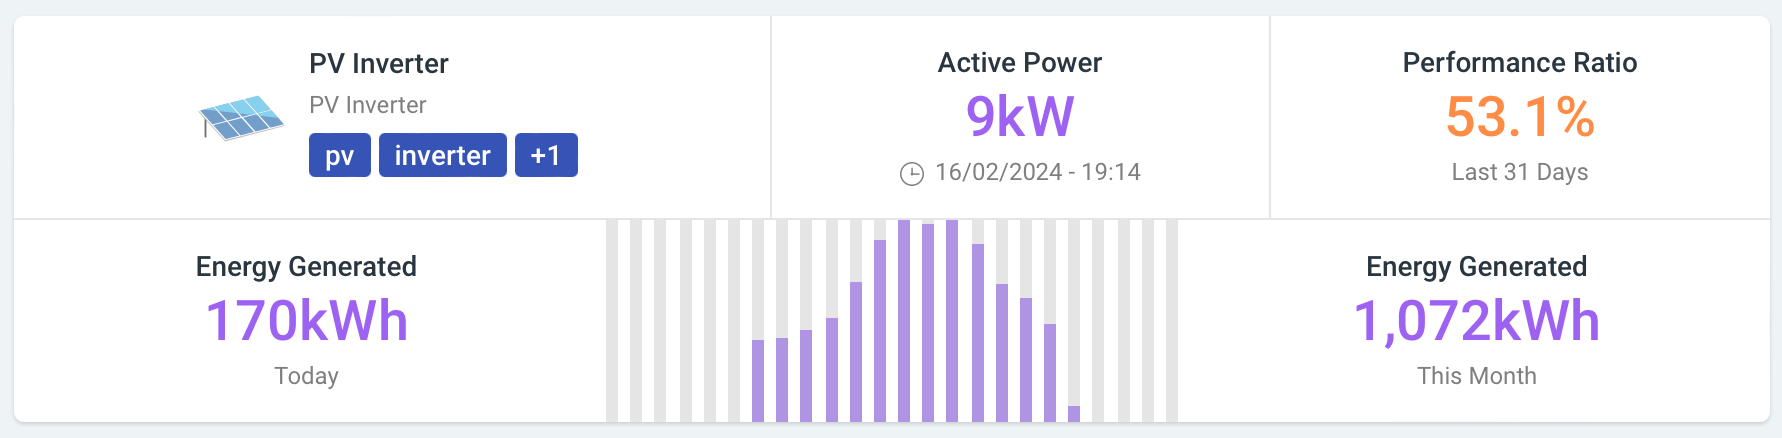
PV Summary
- Active Power: The most recent active power value for the inverter, including the date and time it was last updated.
- Performance Ratio: Expressed as a percentage, shows how much energy the inverter actually produced compared to its predicted potential. Averaged over the last 31 days.
- Energy Generated (Today): How much energy has been generated so far today, including a chart that breaks this down into hourly intervals (1 column for each hour of the day).
- Energy Generated (This Month): How much energy has been generated so far this month.
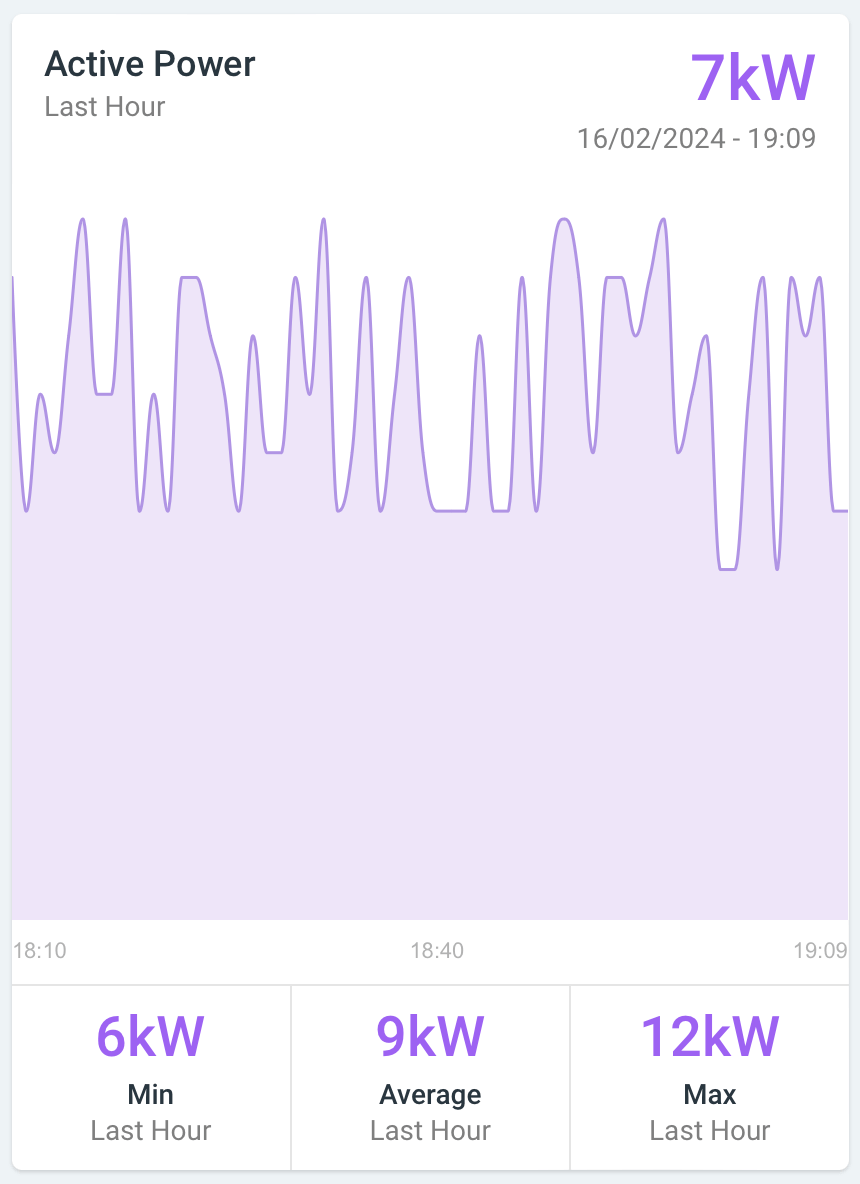
Active Power
Below the summary, is a more detailed visualization of the inverter's active power. It shows the total for the last hour as well as minimum, average, and maximum values for that period, and a chart that breaks down the period by minutely intervals.
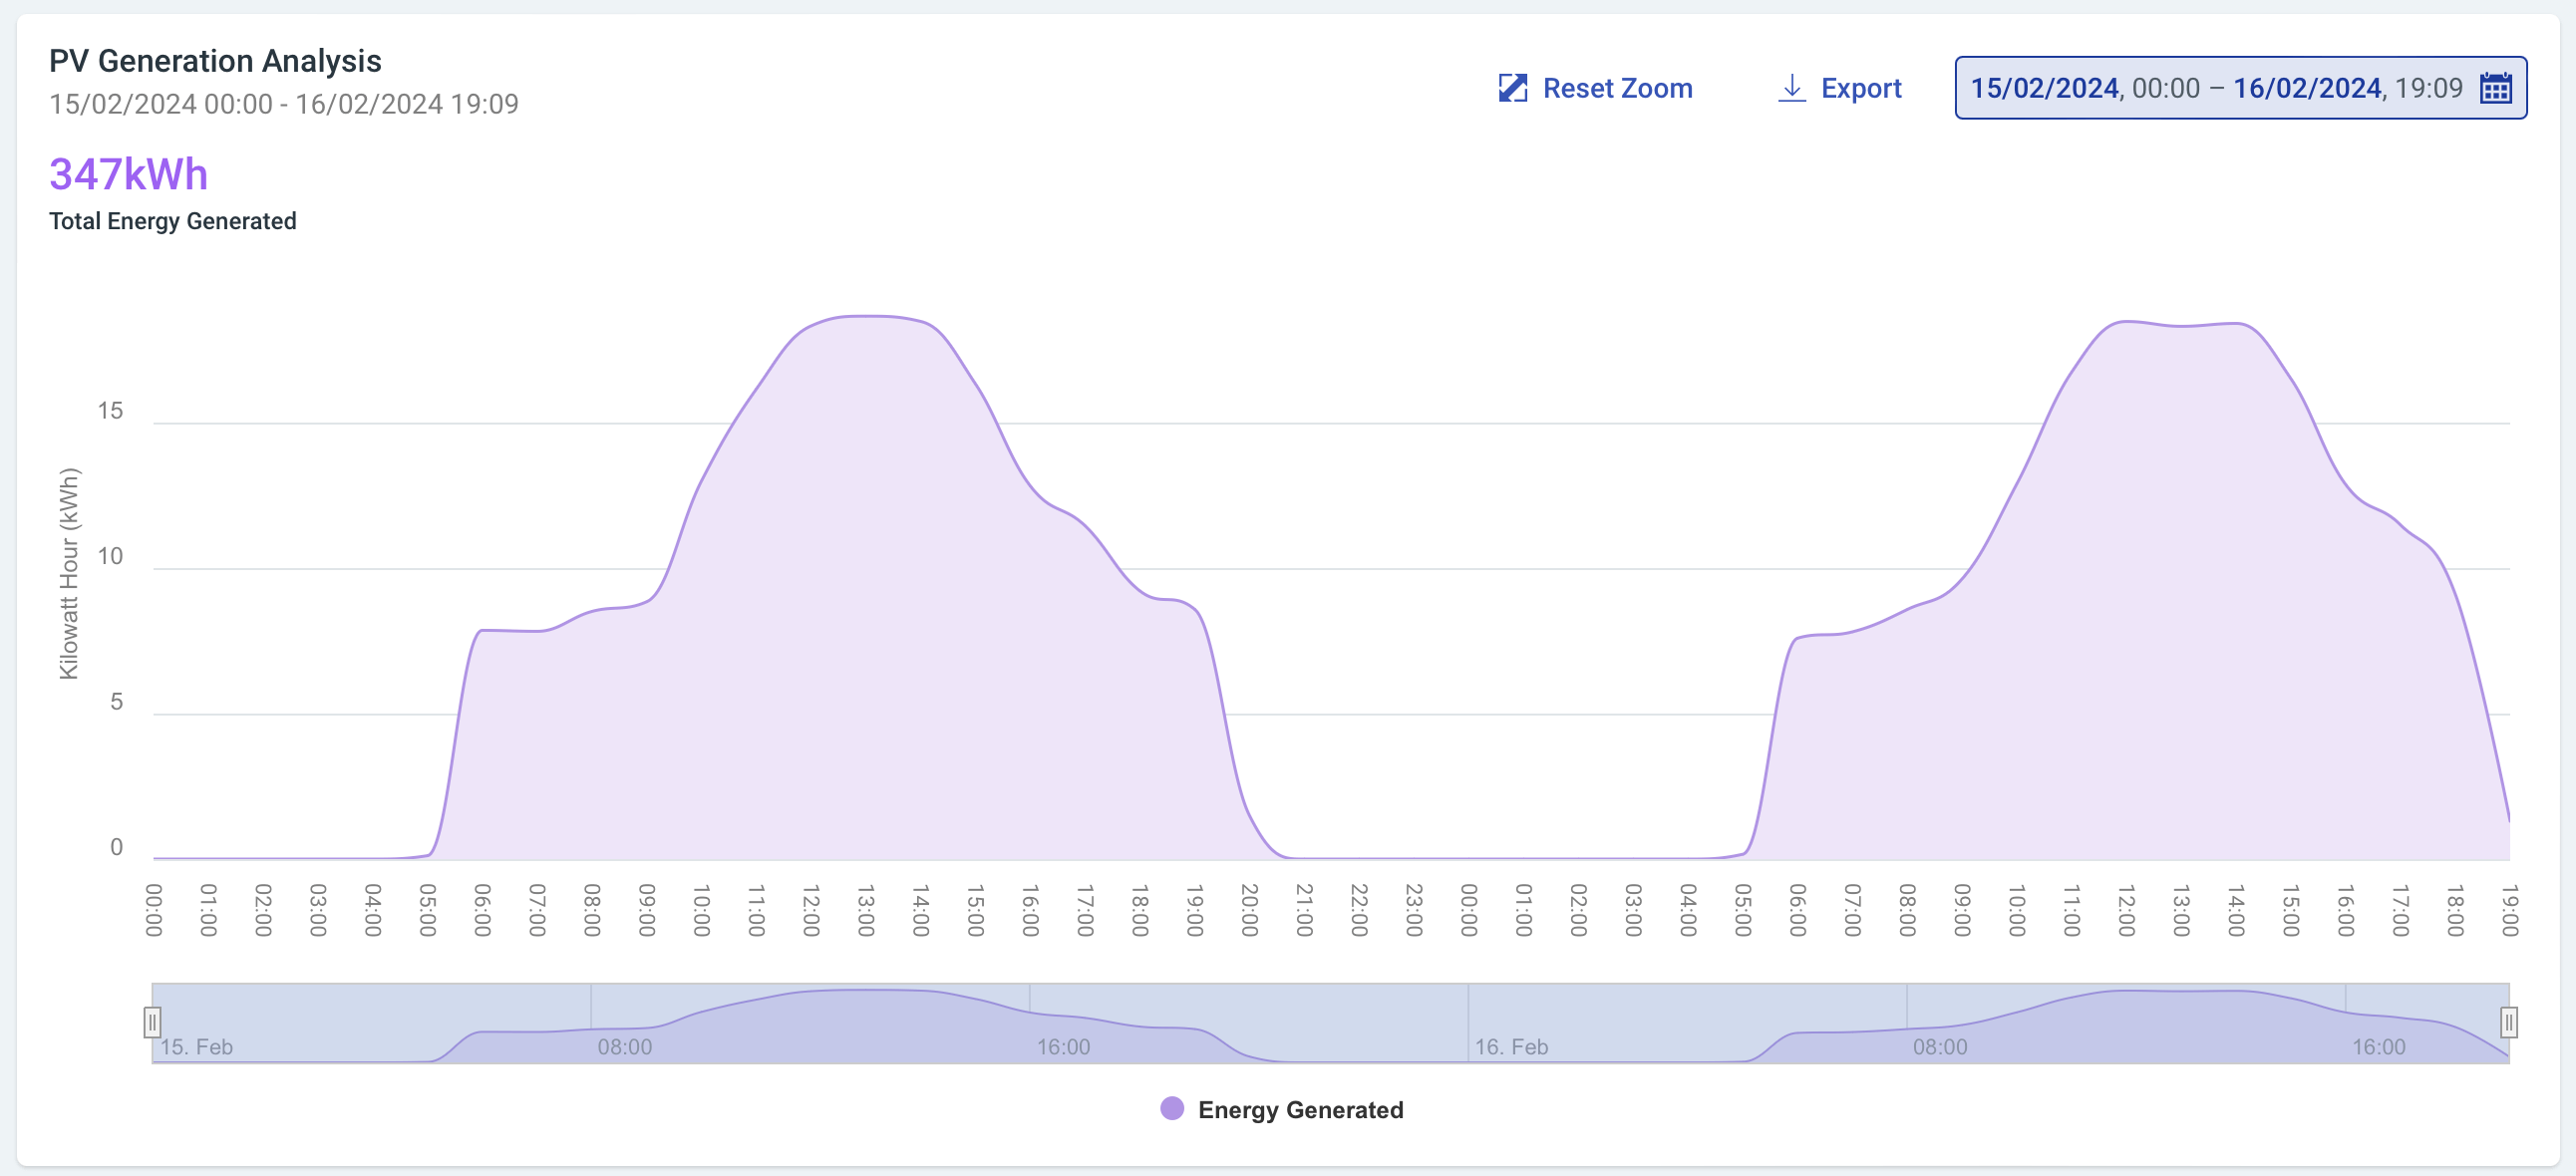
PV Generation Analysis
This chart shows how your energy generation has changed over time. By default it will show generation over the last 31 days at daily intervals. To view generation over a specific time period and interval, you can use the date range picker.
You can zoom-in on a range within the current period by dragging out a rectangle in the chart or by adjusting the handles in the navigator below.
To help with your external analysis, the graph can be exported as a visual or as raw data using the 'Export' button.
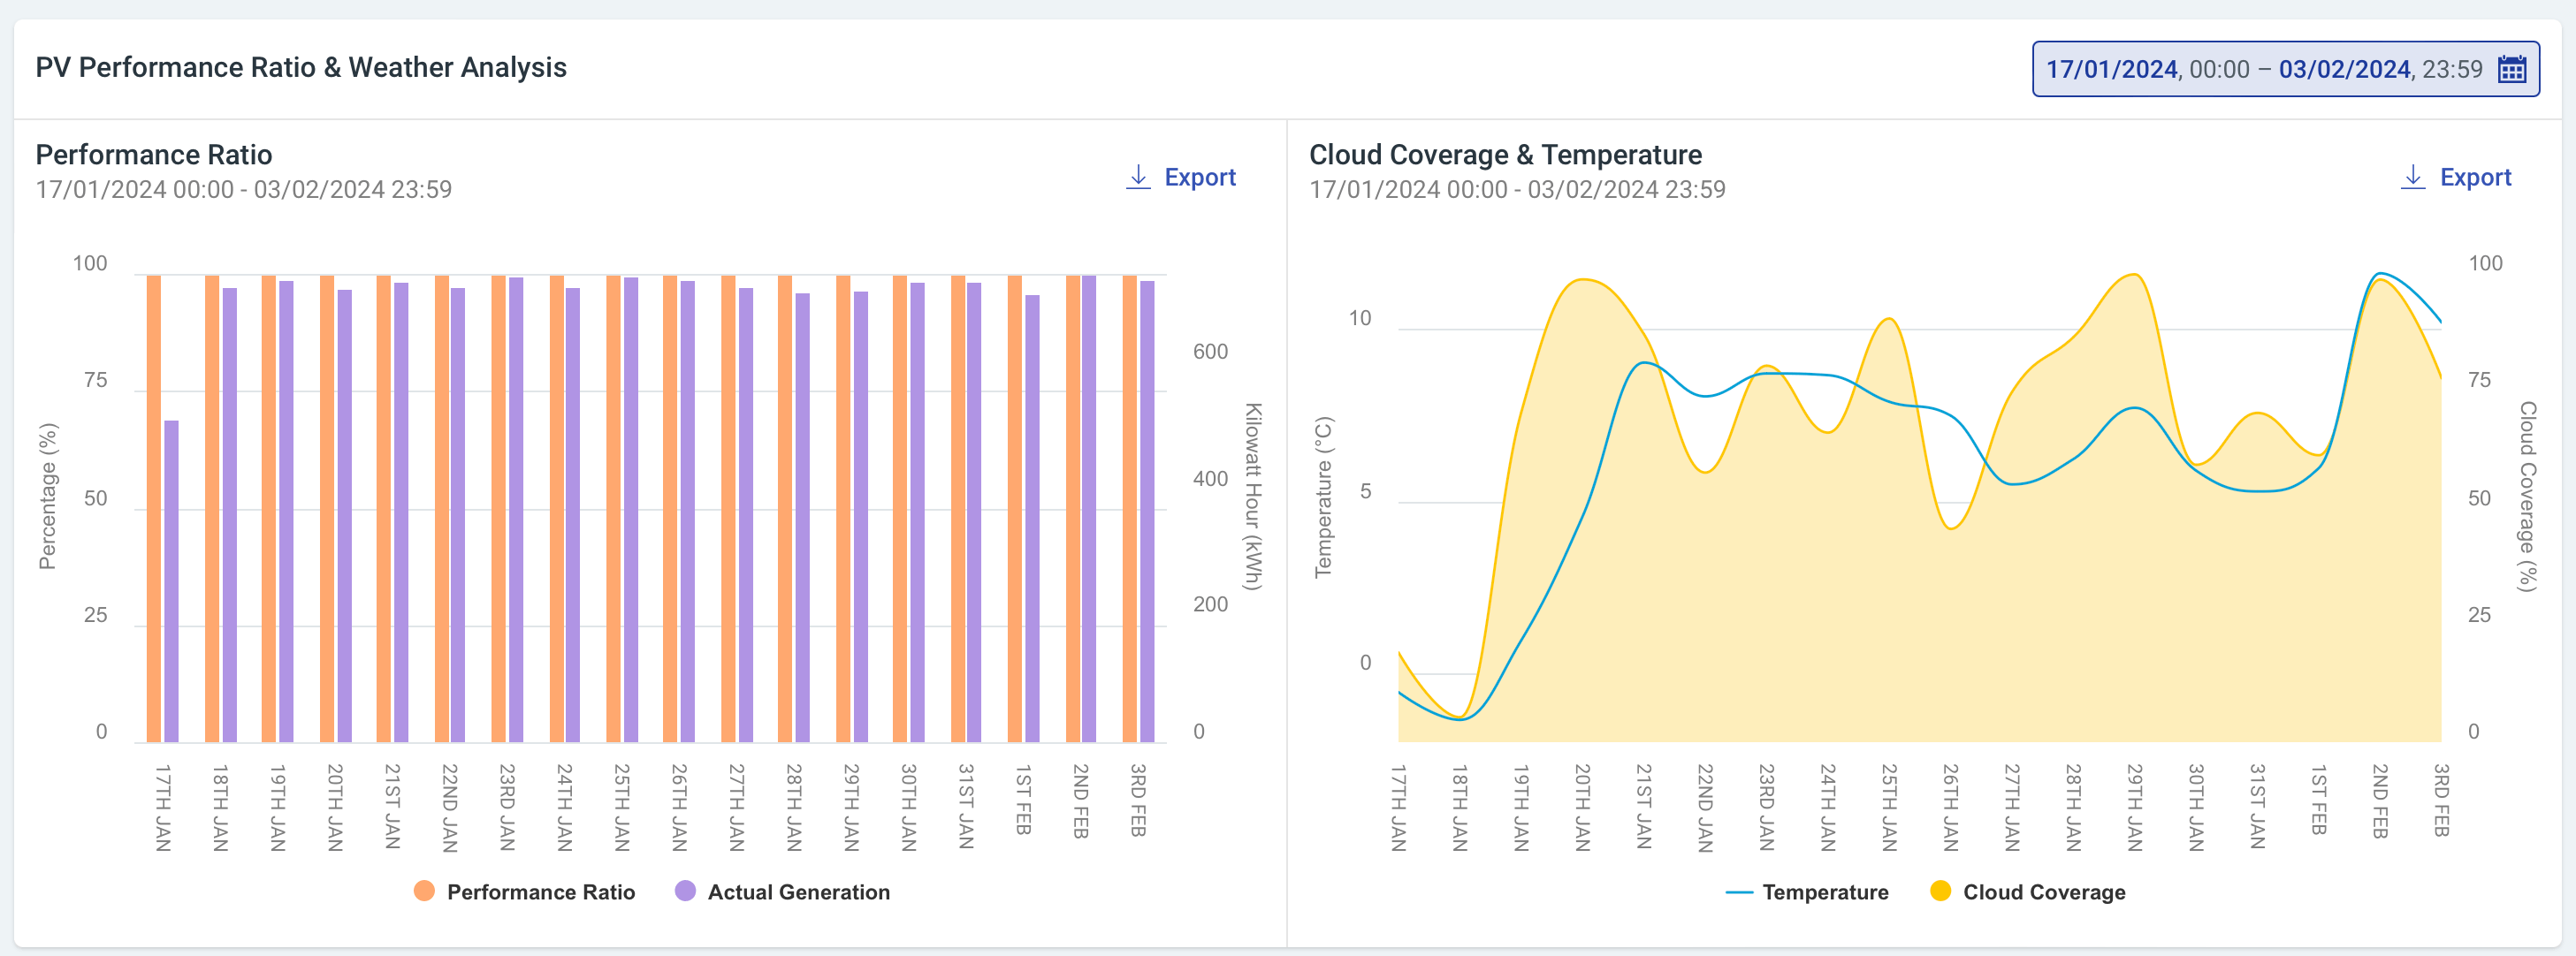
PV Performance Ratio & Weather Analysis
If the site where your inverter is located has the required weather metadata associated to it (time zone and geo coordinates), you will see the PV Performance Ratio & Weather Analysis.
The Performance Ratio and Cloud Coverage & Temperature graphs allow you to compare your inverter's performance ratio and actual generation over time, and how that relates to the weather for your site over the same period.
By default the graphs show data for a 31 day period, at daily intervals. To view generation over a specific time period and interval, you can use the date range picker.
To help with your external analysis, the graphs can be exported as a visual or as raw data using the 'Export' buttons.