February 2024
Although February may be lighter on days than other months, our feature release list has been anything but light!
In Explorer, we're excited to show our brand new overview pages for PV Inverters and Energy Storage Batteries that give you a detailed overview of your assets operation, at a glance. We're also releasing our brand new PV Performance Ratio analysis, helping you understand how well your PV inverters are performing!
We've added support for powerful scheduled reports in Report, so you can get your reports as often as you need them - saving you a lot of time!
In Energy Tools, we've added support for viewing a meters last refresh times, as well as support for users being able to manually trigger for their meter's data to be refreshed. Finally, we've added support for receiving third-party half-hourly meter data via MQTT, adding even more integration options for your solutions.
Explorer
PV Inverter Insights
We're excited to share our brand new PV Insights overview for PV Inverters deployed in Hark Explorer. When viewing a PV Inverter in Explorer, you'll get a great overview of the performance and activity of your PV Inverter at a glance.
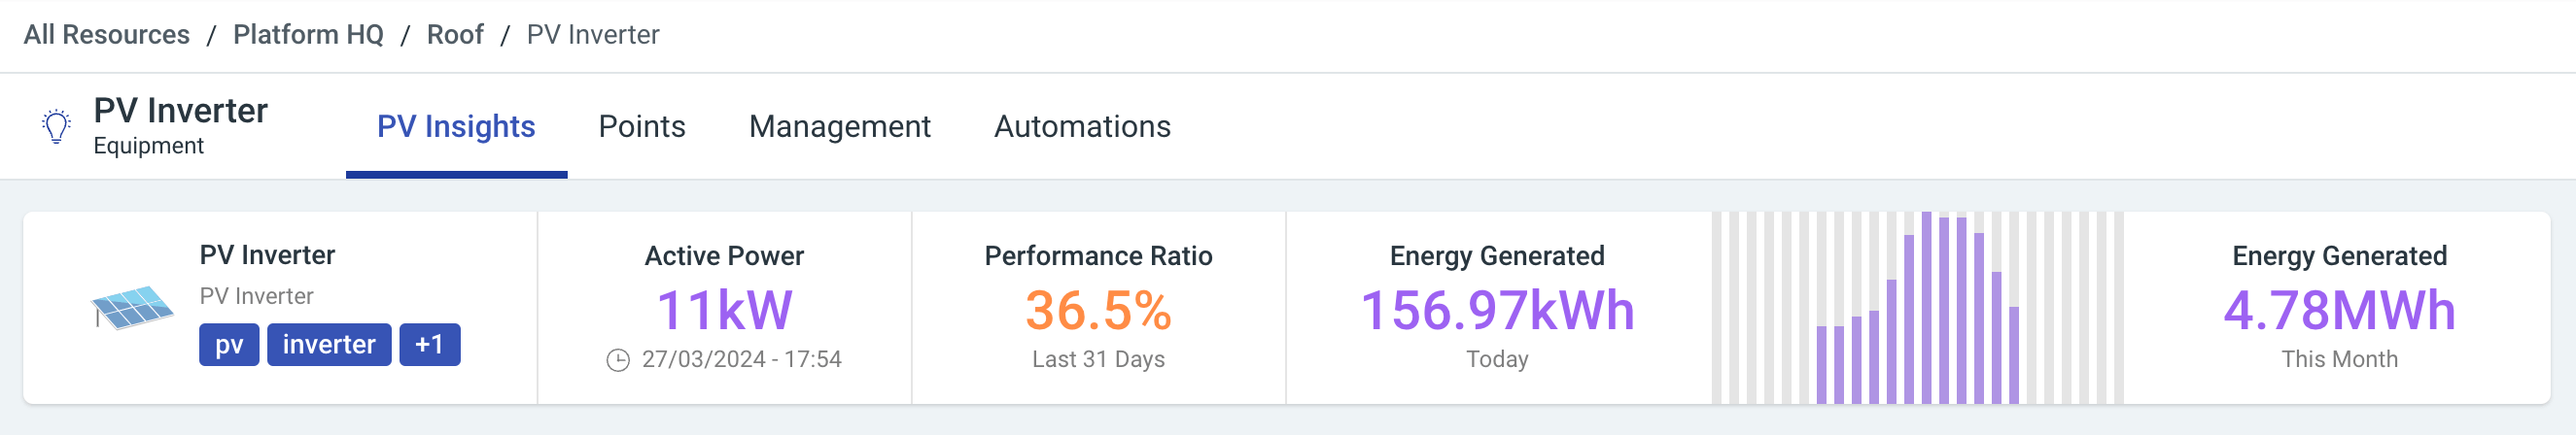
Alongside a summary of the PV Inverter, you'll see helpful top-level statistics such as it's Active Power, Performance Ratio and the Energy it's generated so far today, and this month.
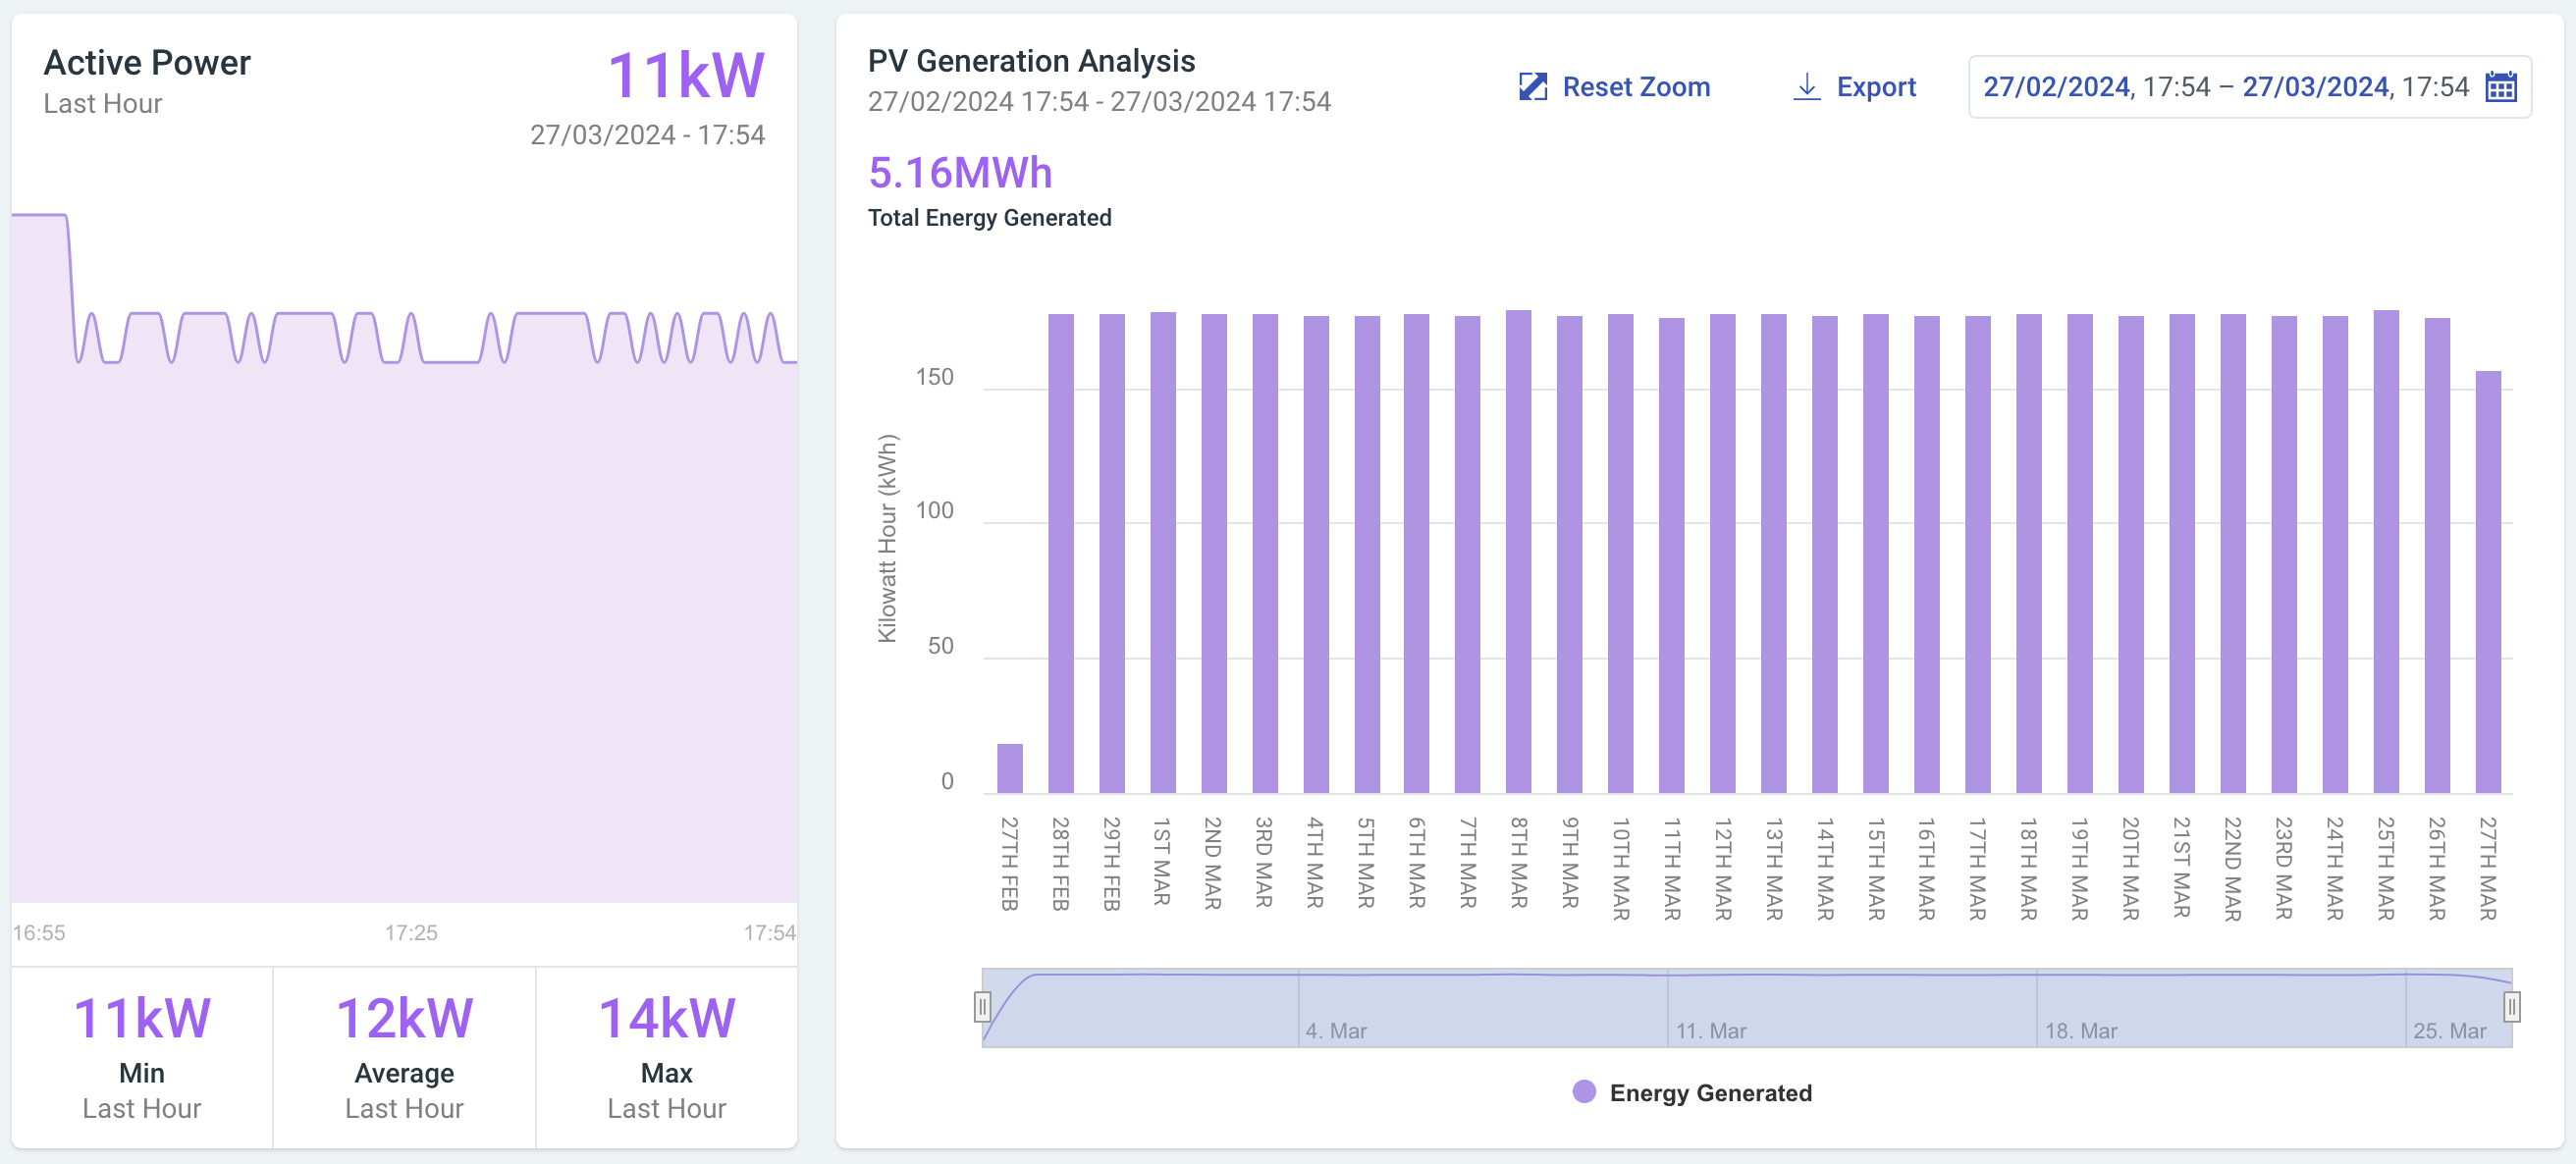
We'll also show you your PV Inverter's Active Power over time, with the minimum, maximum and average for the last hour. The PV Generation Analysis allows you to analyse your PV Inverter's generation over a configurable time period and interval. Using our powerful Export button, you can pull this data out in to your internal reports, or presentations.
Performance Ratio & Weather Analysis
As part of the new PV Insights overview, you can visualise and assess the effectiveness of your PV Inverter, to understand how well it's performing. Performance Ratio's allow you to do just this, by comparing what your PV Inverter actually generated to what it should have generated given it's configuration and external factors, such as the weather over time.
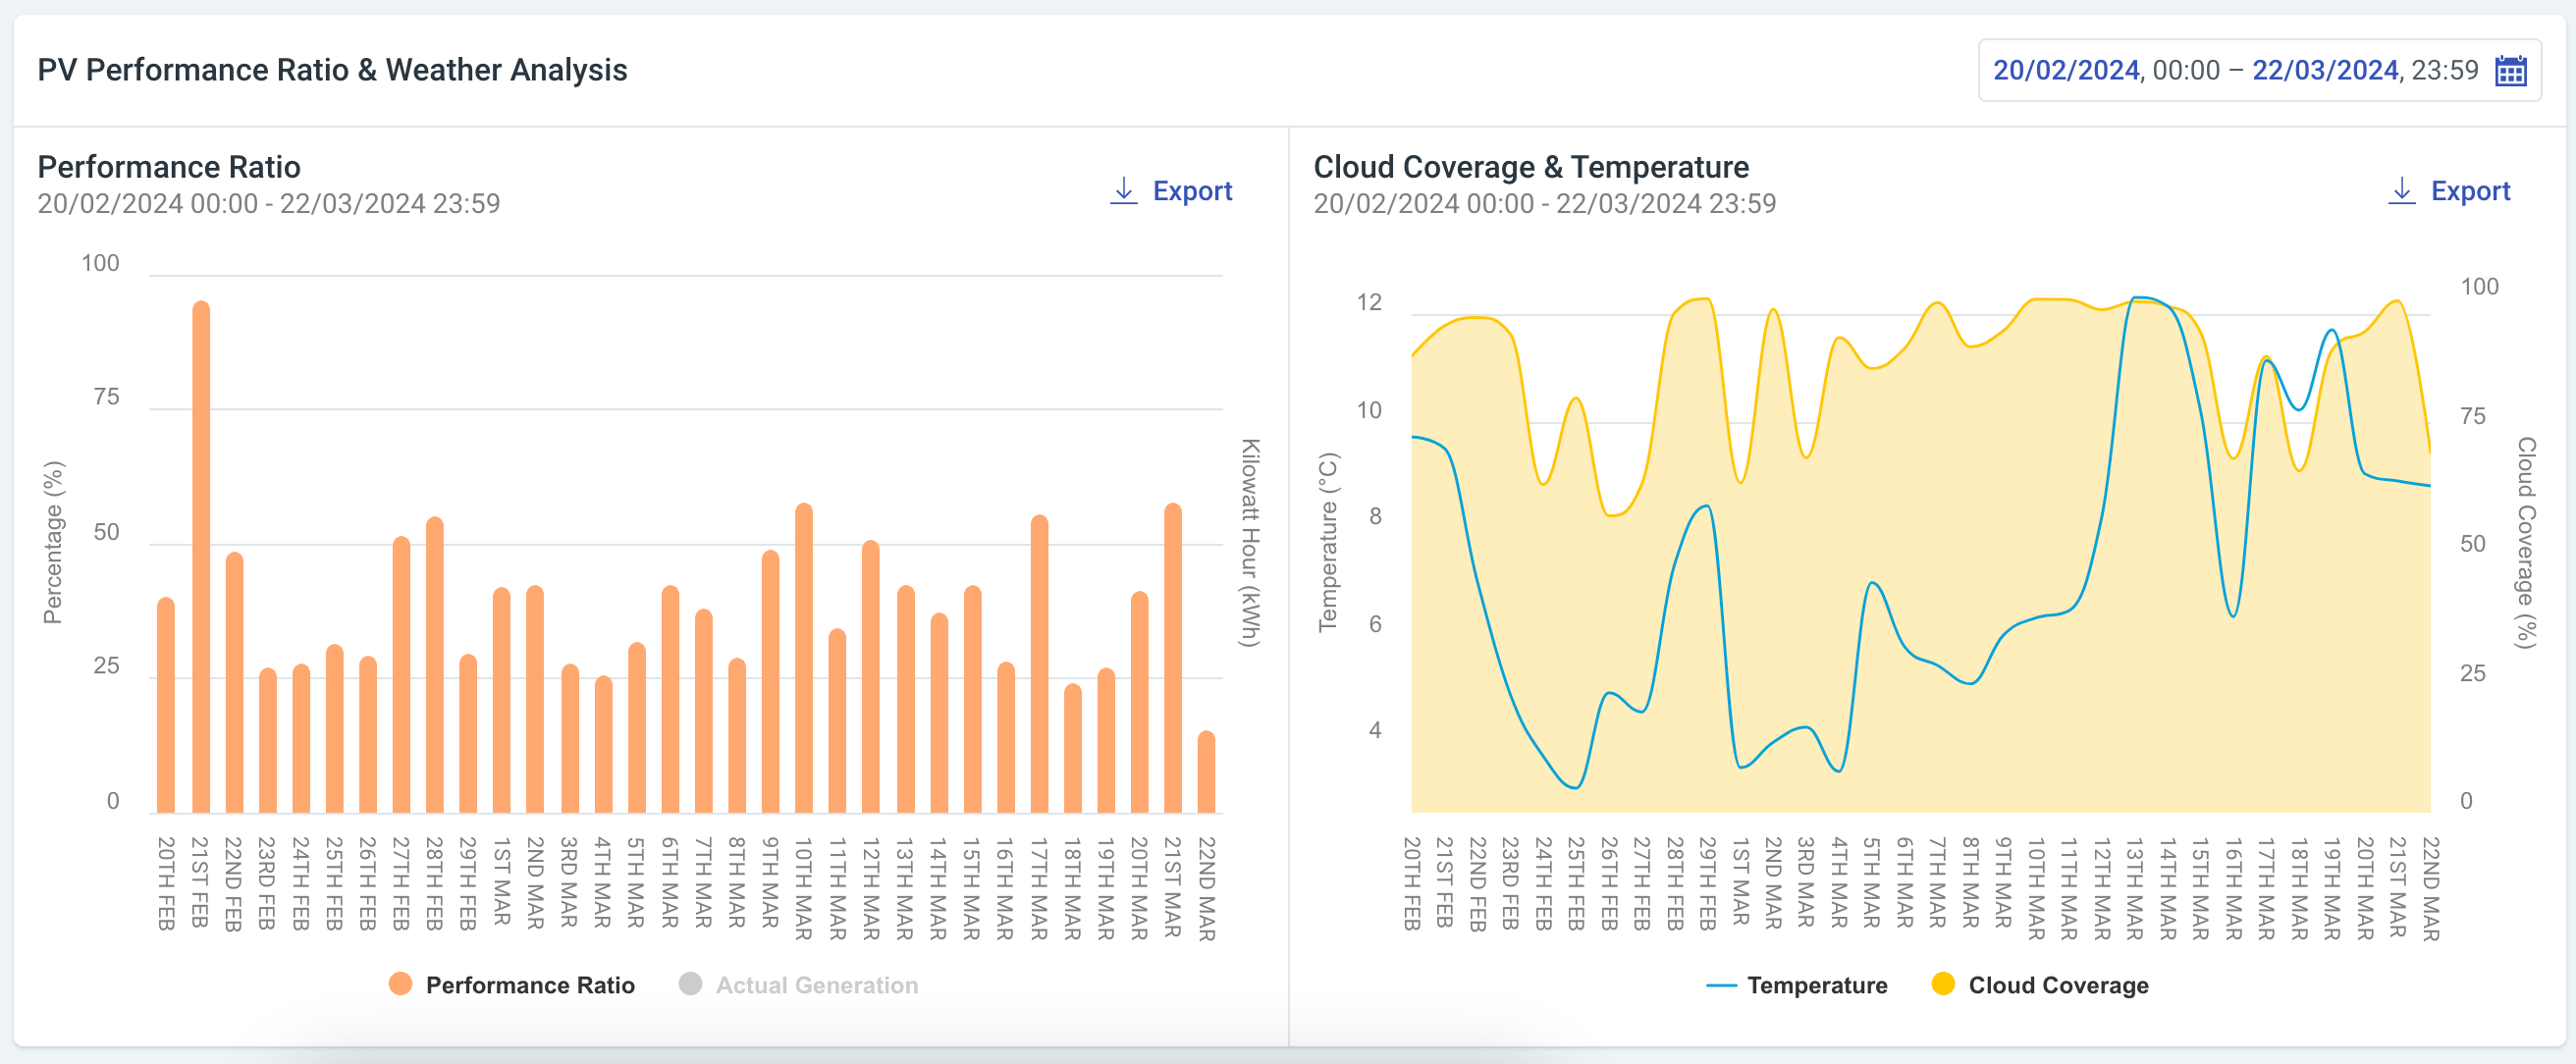
The new Performance Ratio graph can be configured with a range of time-ranges and provides a breakdown of Performance Ratio's over the selected time frame. As always, you can export this graph and it's data for your reports and presentations.
Alongside the Performance Ratio graph, you'll see an overview of the cloud coverage and temperature over the same time period as the Performance Ratio's being reported to add more context to why your PV inverter may, or may not have, generated as much energy as it should have.
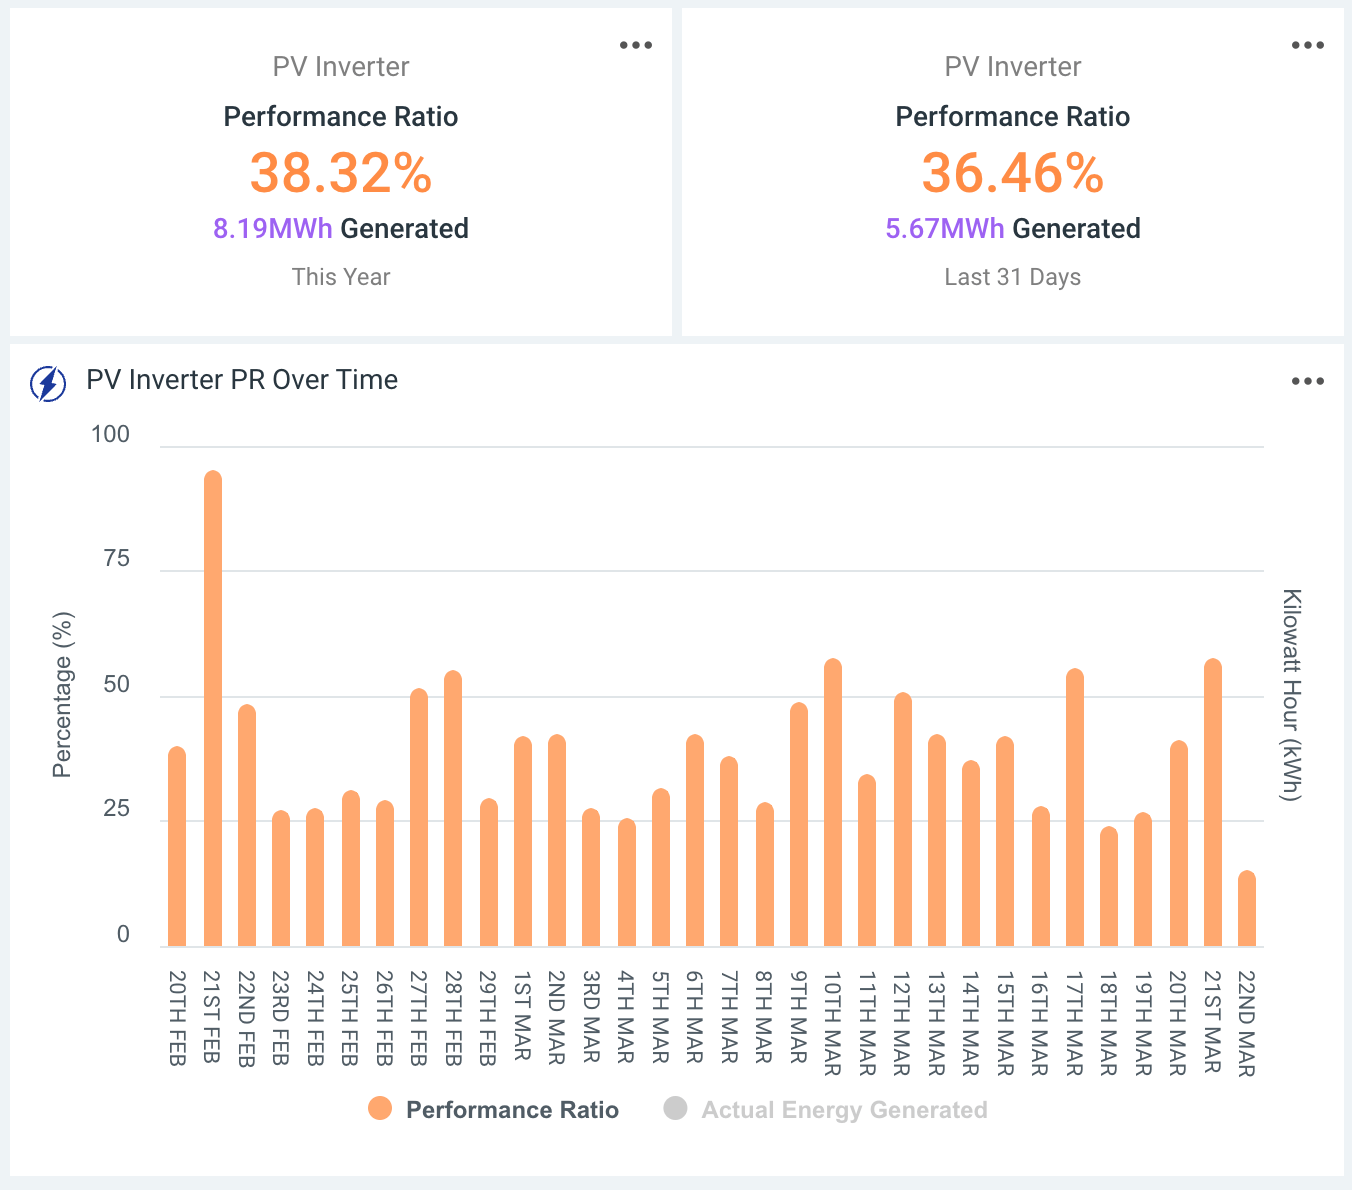
We've also added some fantastic new widgets for Performance Ratio's, allowing you to create great custom Dashboards to see your PV Inverters Performance Ratio's at a glance.
Energy Storage Batteries Overview
Similar to the PV Insights overview, when viewing an Energy Storage asset in Hark Explorer, you'll get a great overview of your batteries performance and activity over time.
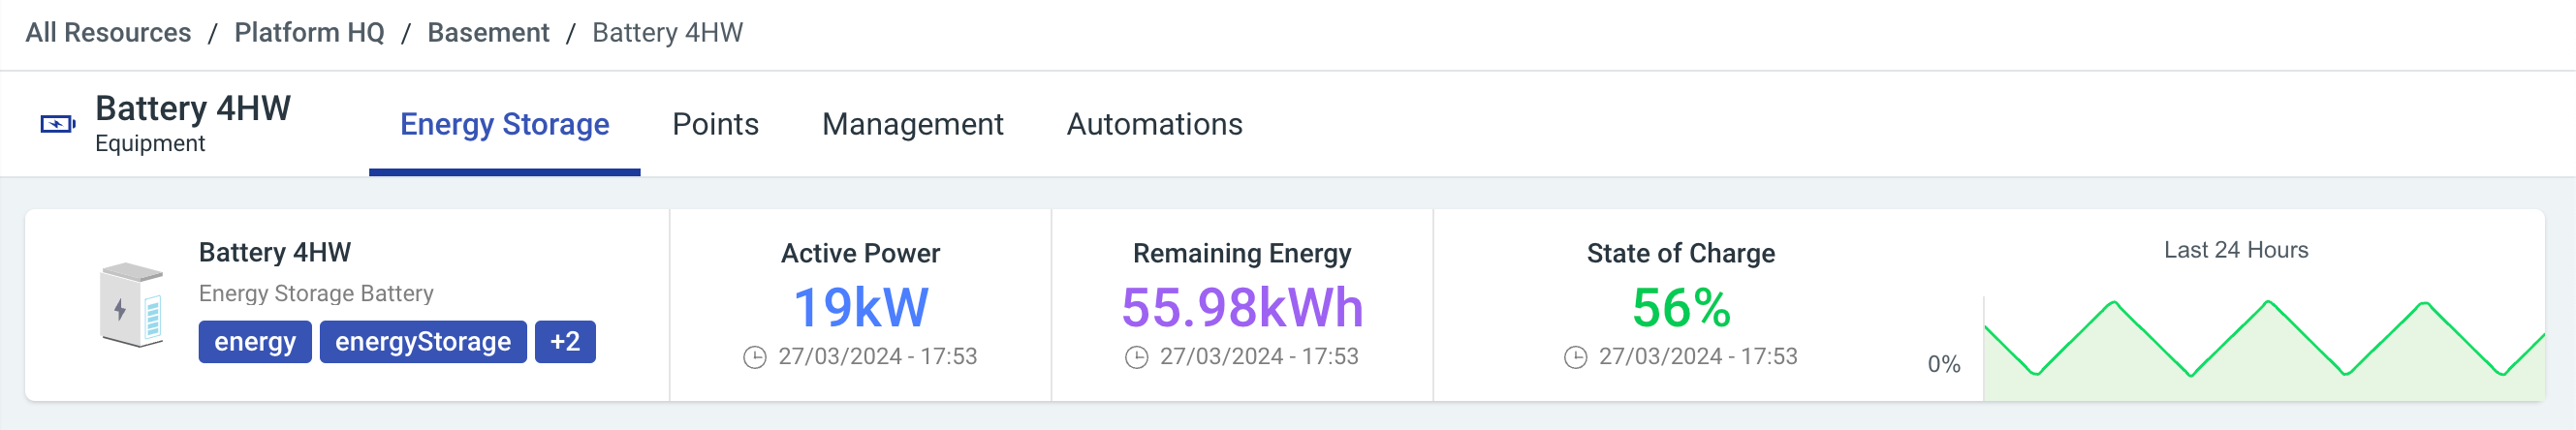
Each battery presents a summary of information at the top level, including the current Active Power, Remaining Energy (kWh) and the State of Charge over the past 24 Hours.
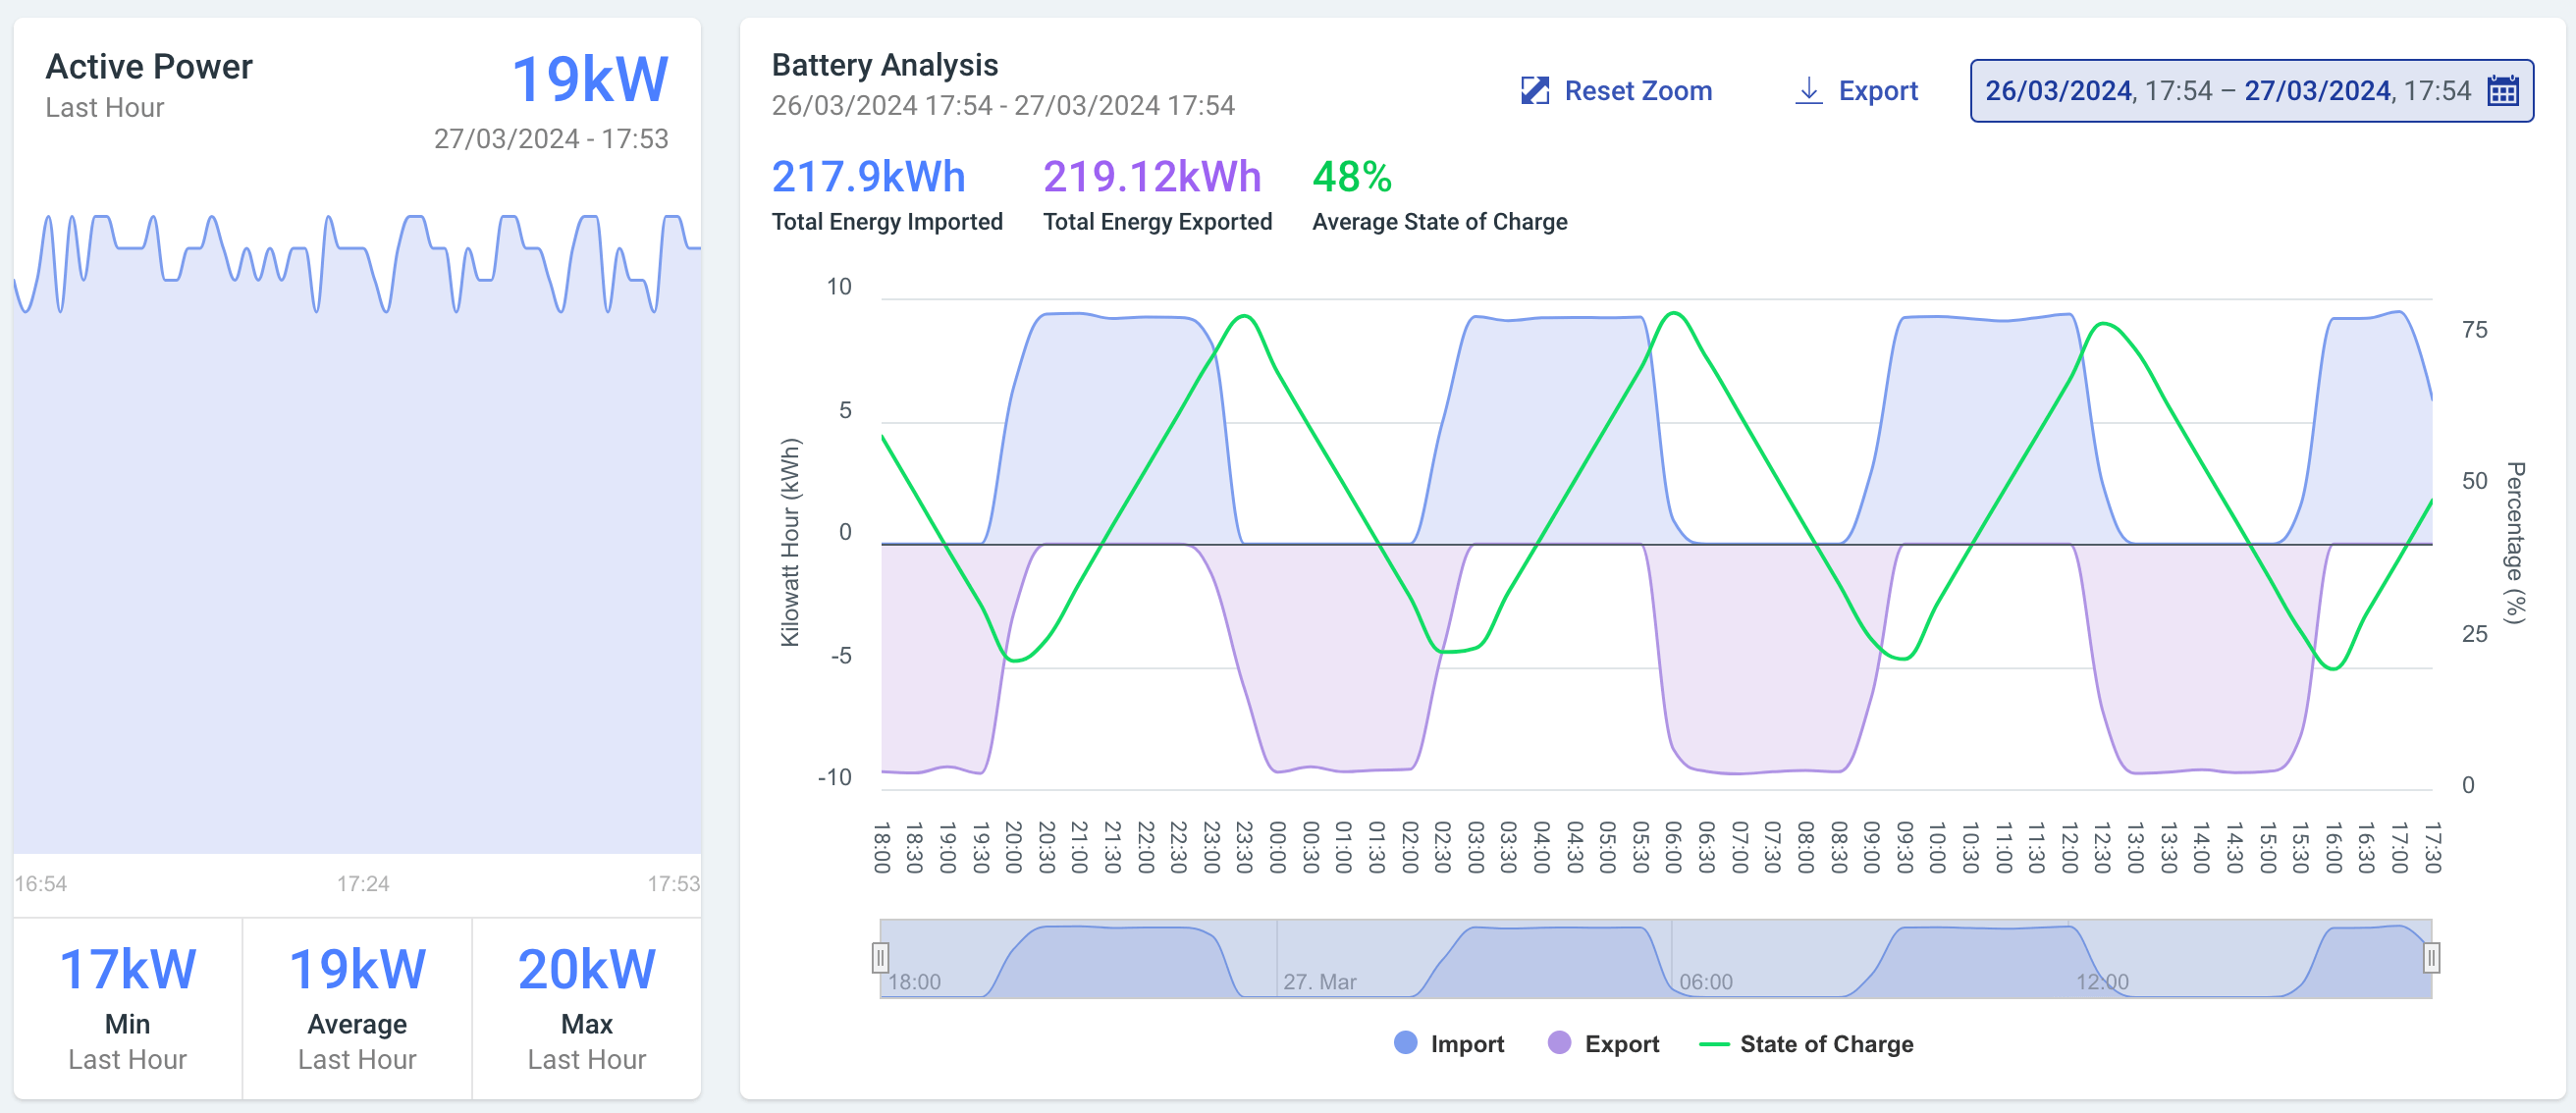
You'll also be able to see a breakdown of the batteries Active Power over the last hour, alongside the Battery Analysis graph which can be used to understand your batteries import and export energy over time, compared with the state of charge.
Reporting
Our new Scheduled Reports are extremely powerful, allowing you and your colleagues to get the reports you need, as often as you need them. In Reporting, use the Schedule Report button to configure a scheduled report.
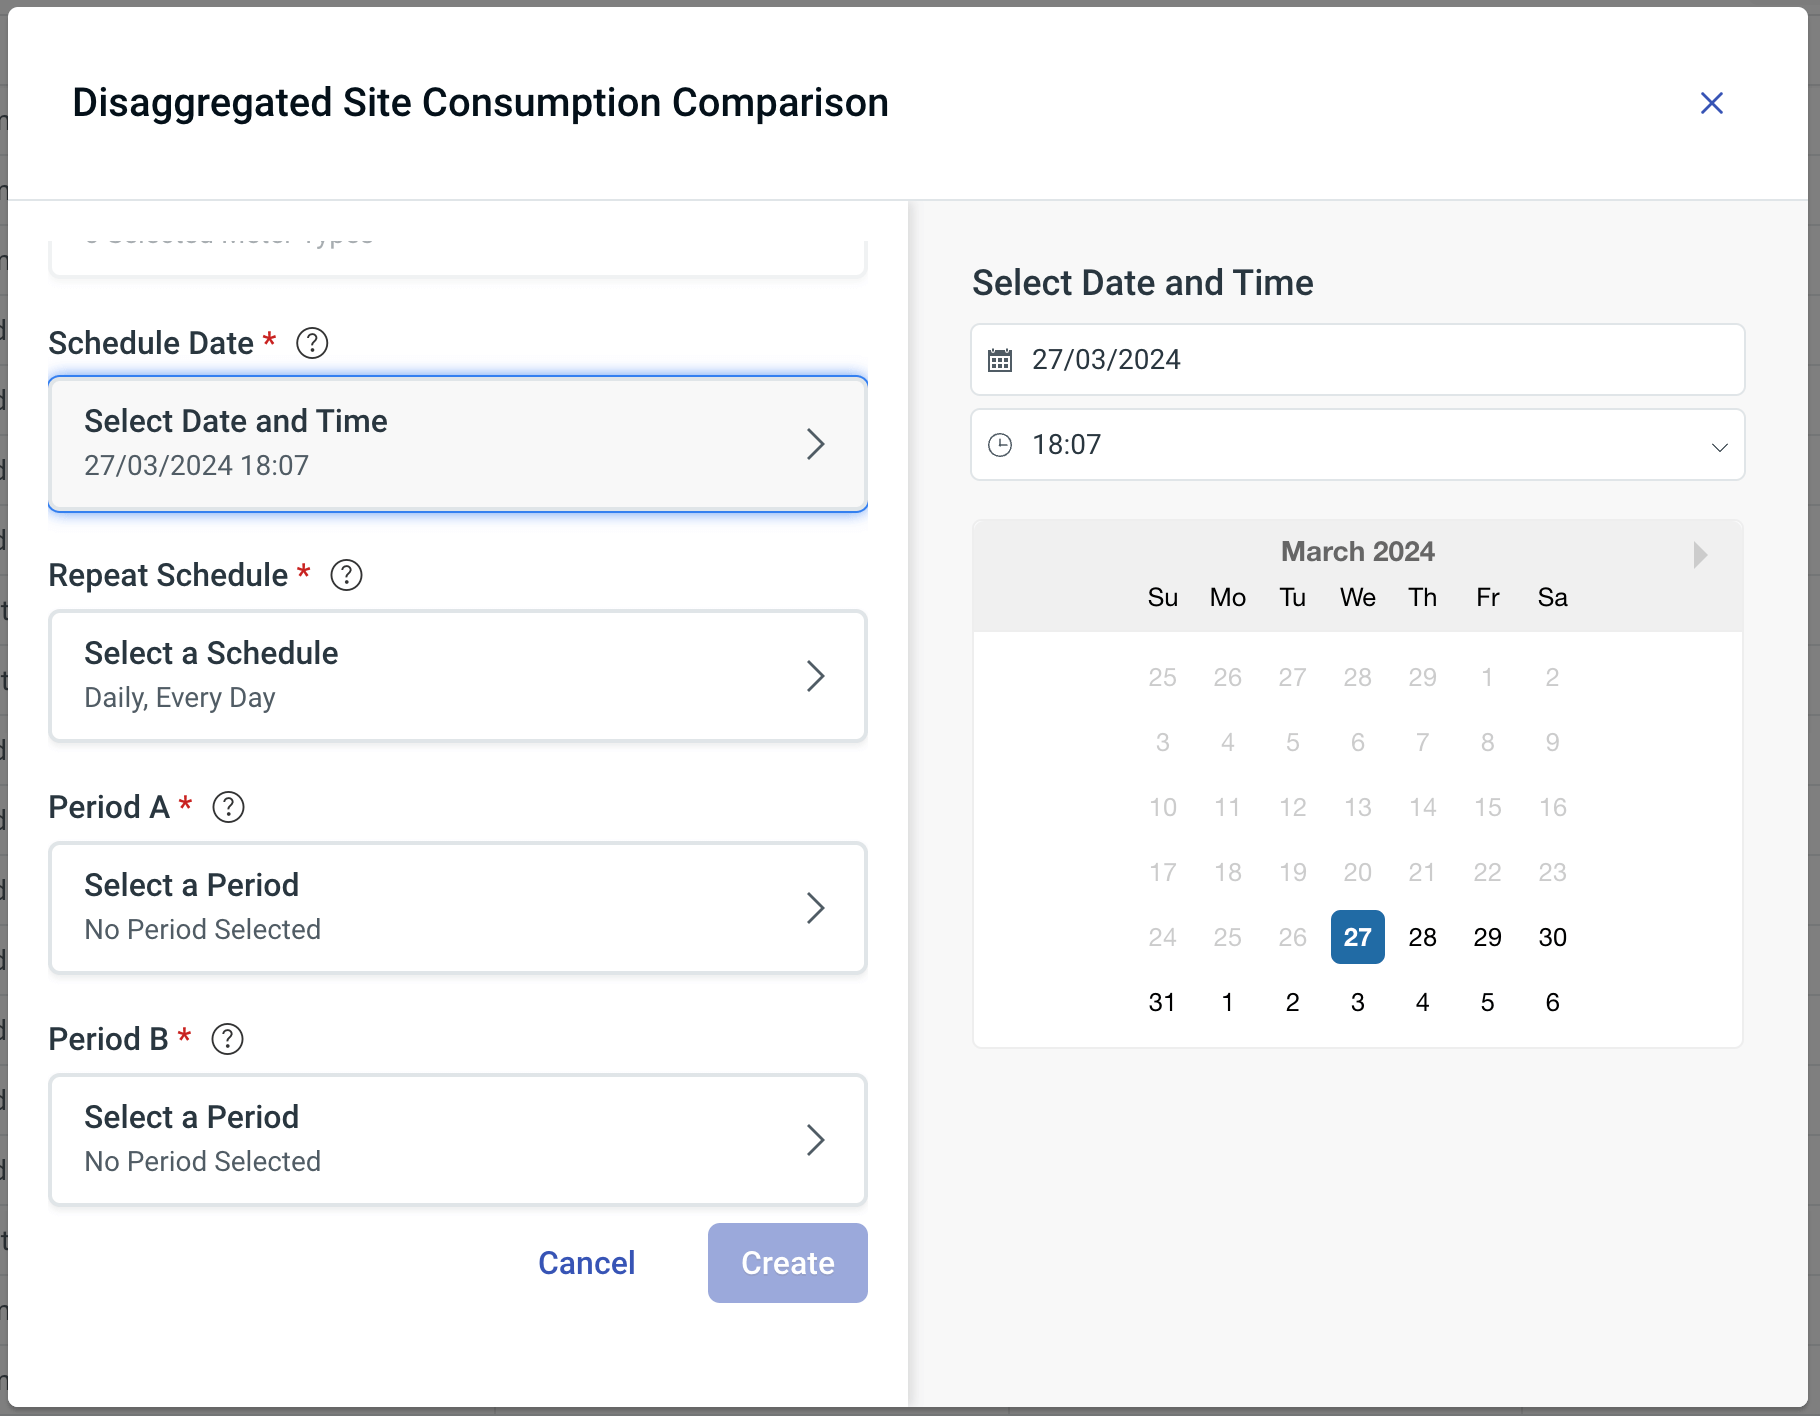
For more information on how to schedule a report, please see the Guides under Hark Help. We've got a lot more to come for Reporting, so stay tuned!
Energy Tools
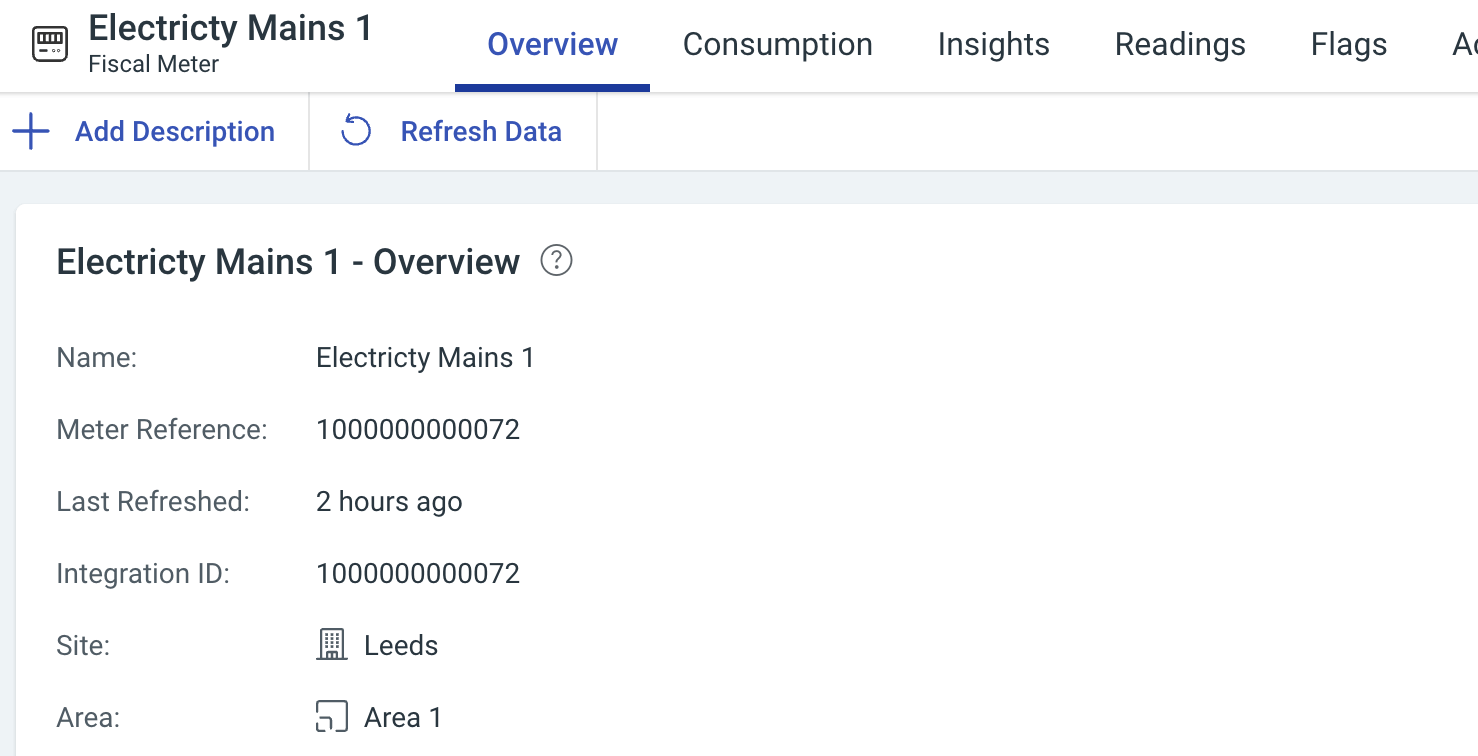
New feature alert! Users now have visibility into the latest refresh time for meter point data at the individual meter point level, providing transparency around the most up-to-date consumption metrics. If you want to see the latest consumption values without waiting for an automatic
update; you can use the Refresh button to manually trigger the re-processing of the consumption data. This feature works for all meter types (Fiscal, Sub-meters and Virtual meters).
Once the Refresh button is clicked for a meter, reprocessing will start - users can navigate away from the page whilst this is happening.
That's not all - behind the scenes, we've been working to enable the Energy Tools Hierarchies to receive Half Hourly readings via MQTT supported third parties, making it even easier for third party utility providers to send metering data in to the Hark Platform.