August 2020
In August we’ve worked hard to add some great new analytical features to the Energy Tools module including weather data overlays, zoomable graphs, improvements to our forecasting tools and more.
We’re also introducing a brand new Loss Prevention module which uses vision technology to help detect loss on self checkouts.
Loss Prevention Module
In this release we’ve added a brand new Loss Prevention module to the Hark Platform. With our Loss Prevention technology we can help reduce shrinkage (loss) in industries such as retail with self-checkouts, and more.
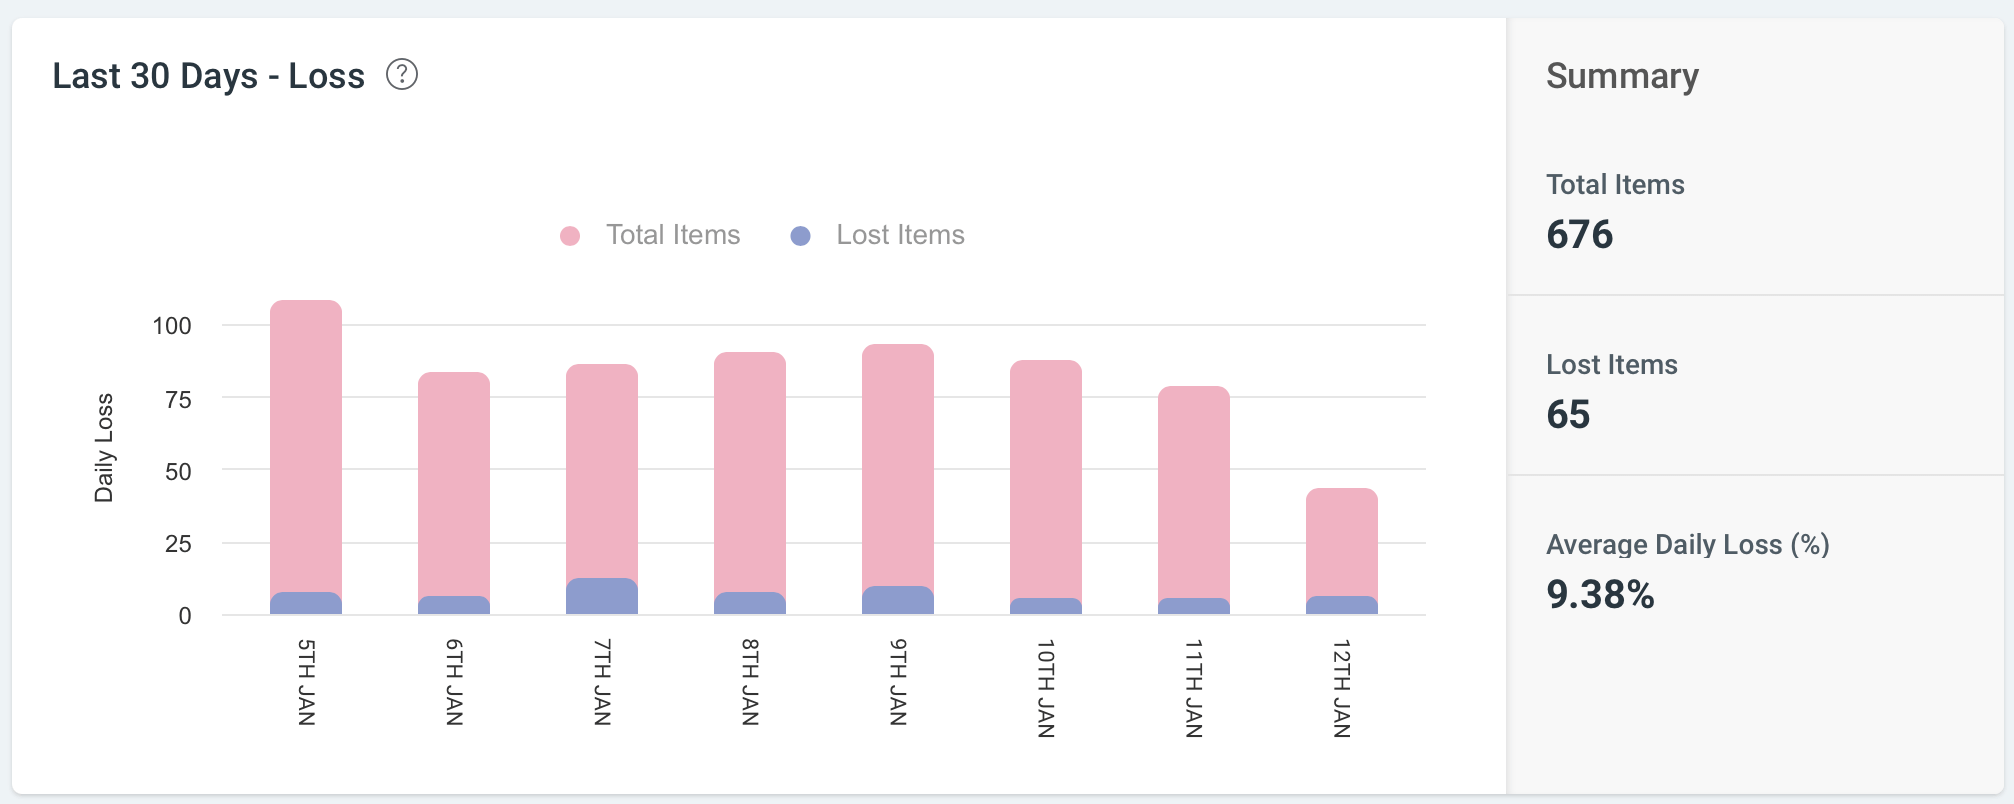
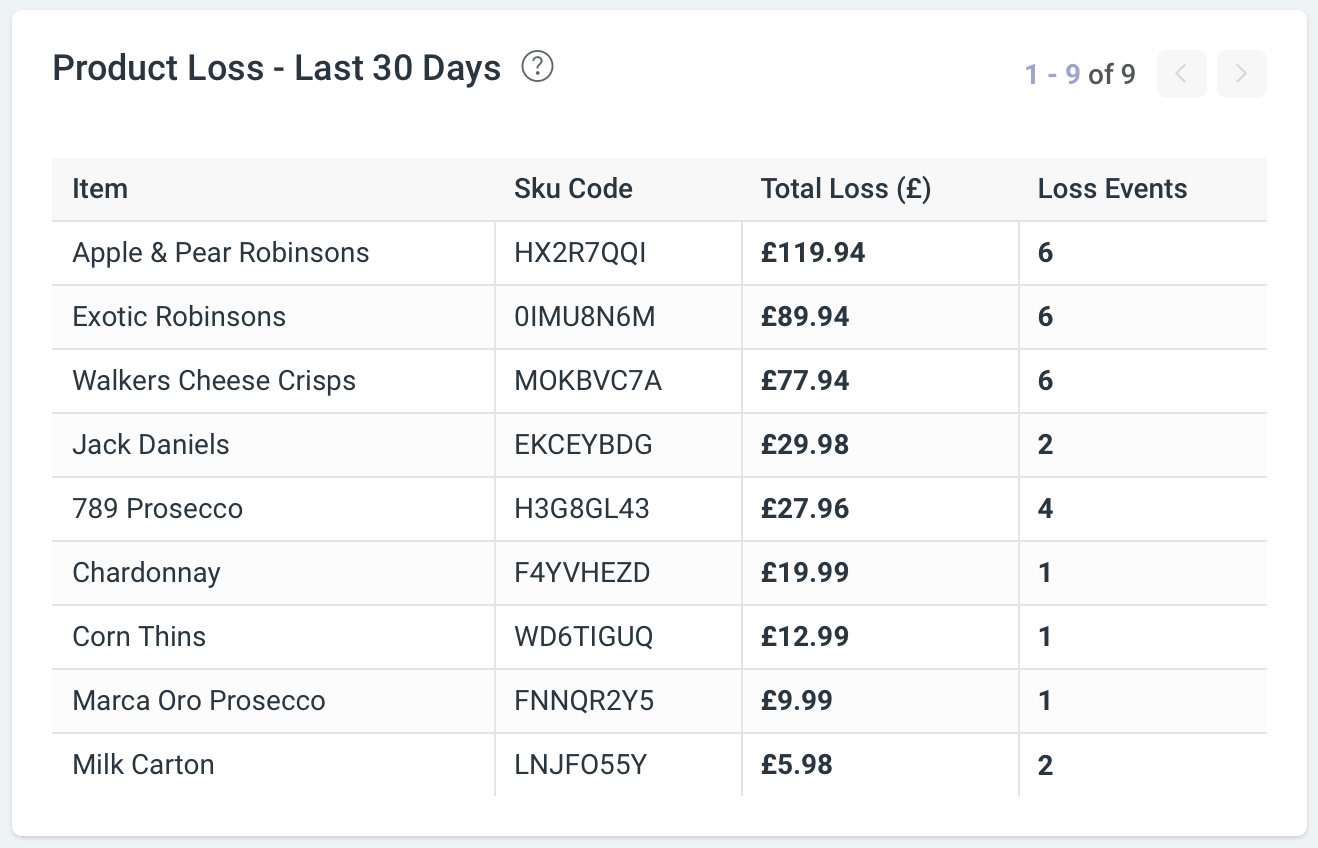
When you have your self checkouts setup in our Loss Prevention module, you can start to analyse the amount of loss at your facilities. You can see helpful things such as your estimated loss over 7 days, the hourly-period in which your loss it at the highest, how much this cost you and what products face the highest loss.
You can find out more about our Loss Prevention technology on our website.
Energy Tools
Amongst improving our forecasting tools, we’ve made some great improvements to the analysis features in the Energy Tools module this month.
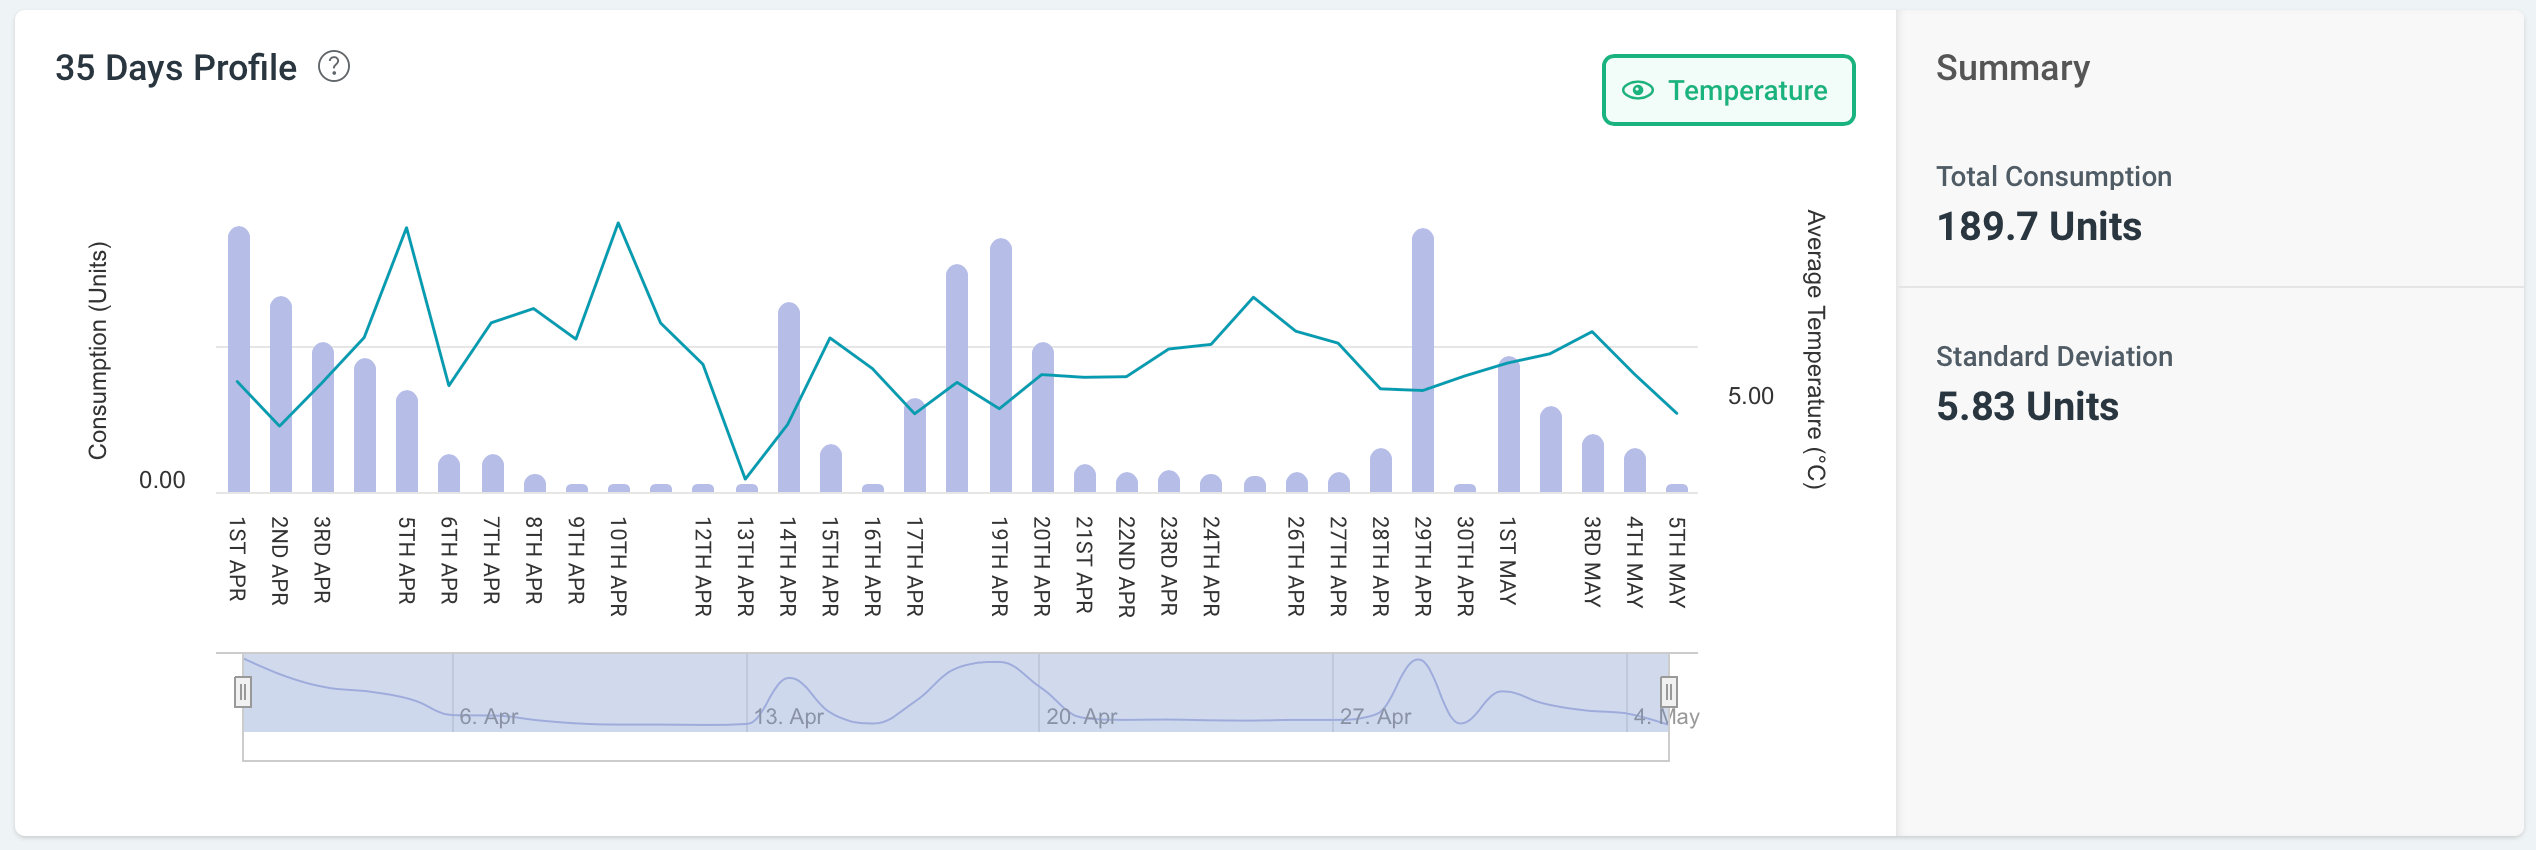
Weather Data Overlays
Now users can overlay weather data on their consumption profiles in order to analyse the impact of local weather on their energy consumption. To use the weather data overlays, simply toggle on the overlay by clicking the Temperature button on the top right.
Metadata Uploading
You can now upload metadata against a dataset in the Energy Tools module for the dataset itself and each meter inside of it. This metadata could be things like the meters MPAN, postcode and other internal information such as an internal meter name and more.
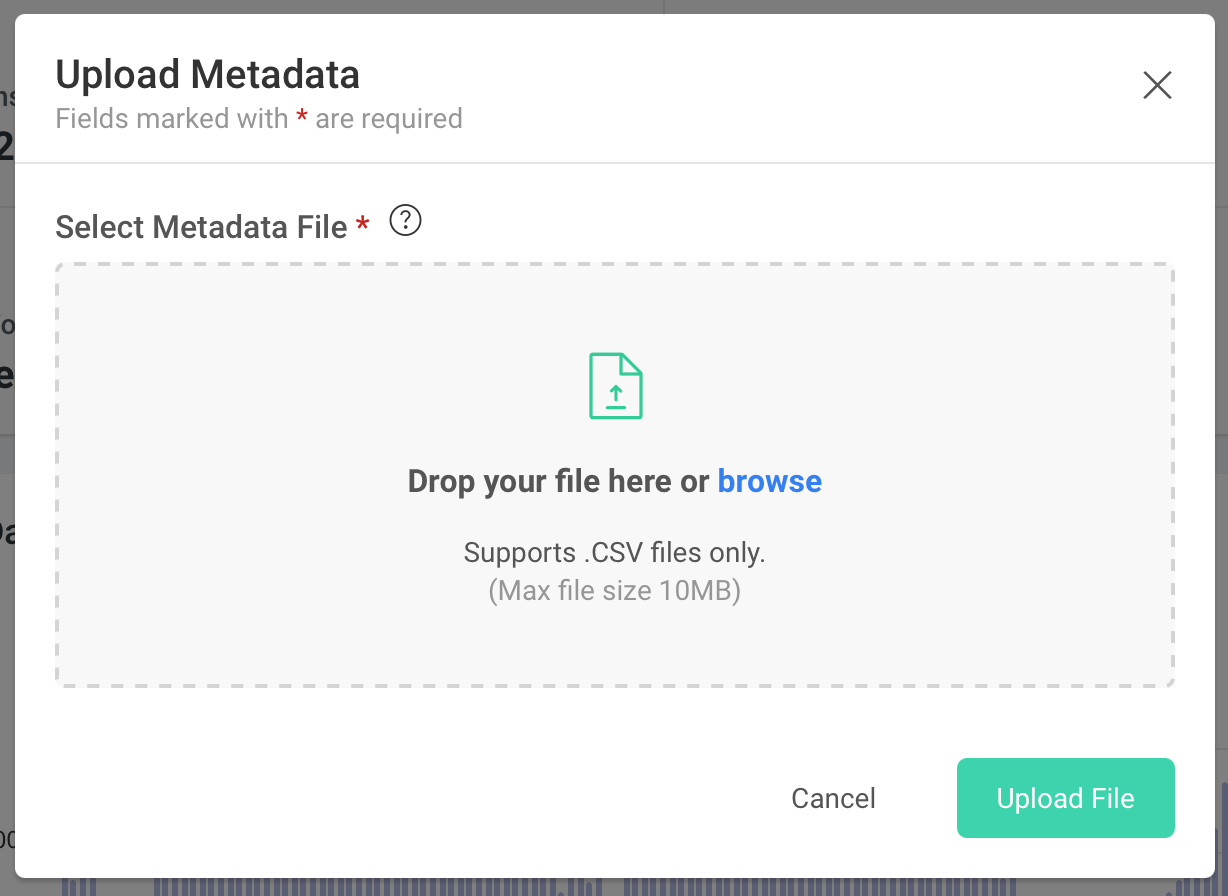
Although this metadata is not currently displayed or used within the module at the moment, metadata will play an important part in the future analysis features of the Energy Tools module allowing users to filter datasets down by this metadata, and more.
Bug Fixes
Amongst various fixes and improvements to the user interface, stability and performance we’ve fixed:
- Forecasts can now only be created when a dataset contains the minimum amount of required data.
- The forecasts view now contains helpful tooltips with information to explain the data being presented.
- When viewing a forecast on a mobile, various controls in the header were not previously visible. This has been fixed.