December 2023
We're wrapping up the year with some brand new Dashboard widgets in Hark Explorer that help you see the information you need to see for your energy assets, at a glance. We've also added a powerful way to export graphs and their data, in Hark Explorer.
Explorer
In December, we've releasing a range of brand new Dashboard widgets to help you have great oversight of your Hark Explorer Equipment easily.
Energy Storage Battery Summary Widget
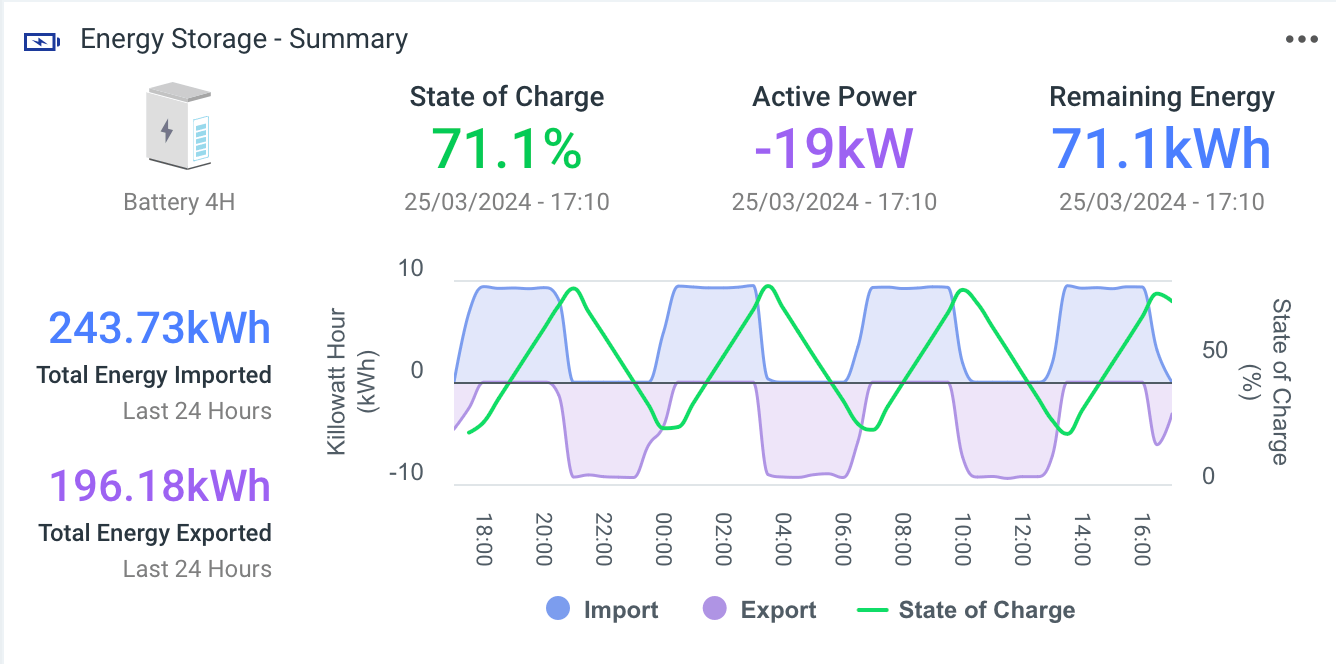
The Energy Storage Battery Summary Widget allows users to visualise the key characteristics of their energy storage solution; including state of charge as a percentage, current power (kW), active power and energy remaining (kWh).
PV Inverter Summary Widget
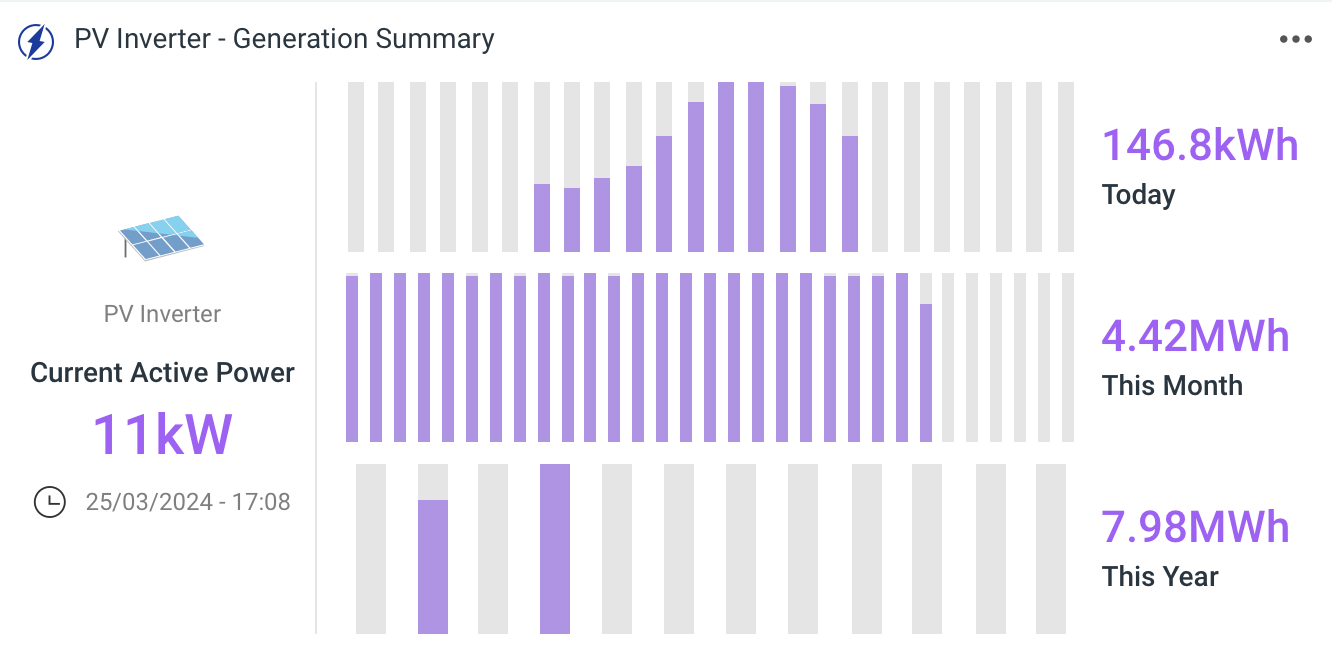
The brand new PV Inverter Summary Widget allows you to visualise the energy produced by your PV Inverter on a daily (30-minute interval), monthly (daily interval) and yearly (monthly intervals) basis.
Latest Point Value Widget
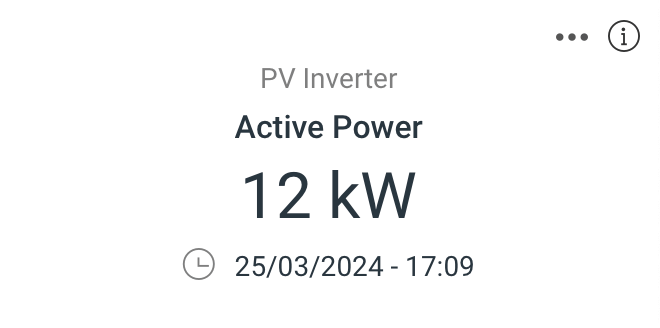
Finally, we have the new Latest Point Value Widget. This new widget allows you to visualise a point's name and its latest value, meaning users can create widgets quickly containing key information - such as the temperature of the cold store or the active power from an energy meter.
Exporting Graphs in Hark Explorer
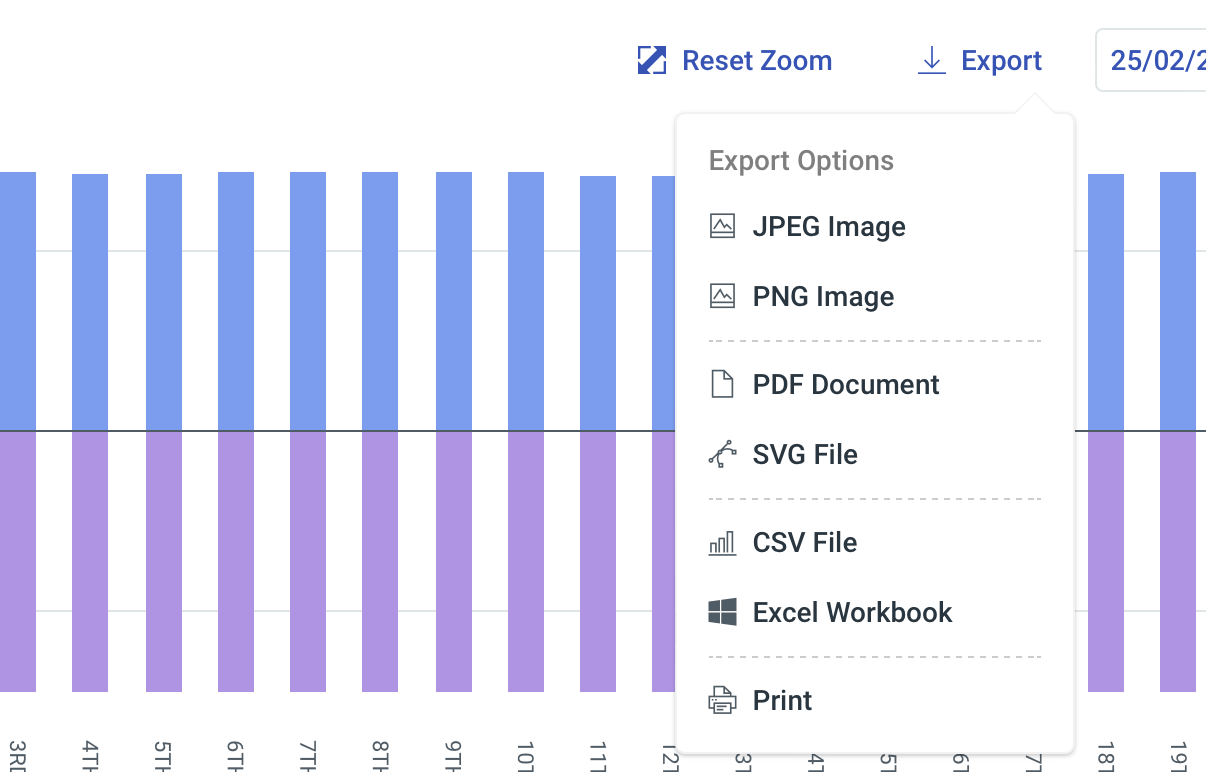
We've added some brand new functionality to a range of graphs in Hark Explorer that allows you to export the data you are seeing in a click. In the Export menu, you'll find options for exporting images, documents and even the data from the graph for you to choose from.
We're looking forward to adding this functionality to more graphs in the Hark Platform.