January 2024
More more more… how do you like widgets? The good news is, we have plenty more Dashboard widgets for your Explorer data, including a Site Weather Data widget, and multiple Equipment Information widgets.
Behind the scenes in Energy Tools, we've redefined data processing to accommodate the growing needs of our users, allowing us to support much larger sites with lots of meters.
And last but by no means least, the shiny new Reporting module says hello world!
All in all, it's been a very busy start to the year, and it's only getting busier. We can't wait to show you everything else we're working on in 2024!
Explorer
Site Weather Data Widget
Have you ever thought to yourself, "external weather conditions affect my site's performance - how do I manage the external factors to support my site's productivity/efficiency better?". Well ask no more, as in this release of Explorer, we have enabled support for a Site Weather Data widget which can be added to any Dashboard.

For each geographically defined Site, the current and forecasted weather data will be stored and displayed. This includes temperature, rainfall, and humidity. As part of this widget, a graph showing cloud coverage in relation to temperature is also provided.
By utilising this widget, users can easily comprehend how environmental conditions may influence the performance of their on-site assets, including PV and HVAC systems.
Energy Meter Import or Export Widget
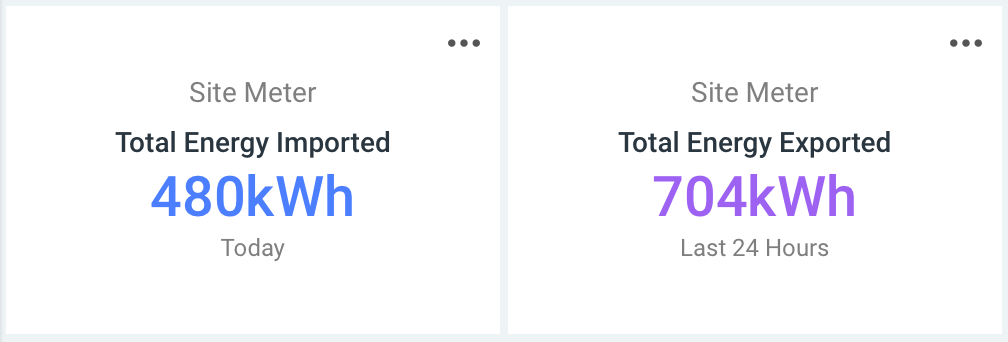
The newly introduced Energy Meter Import or Export Number Widget shows the either the energy imported or exported for a time period for a meter. This widget provides a quick and easy way to see the latest total values for a meter, which can be understood at a glance through the clever use of colour coding.
Equipment Points Table Widget
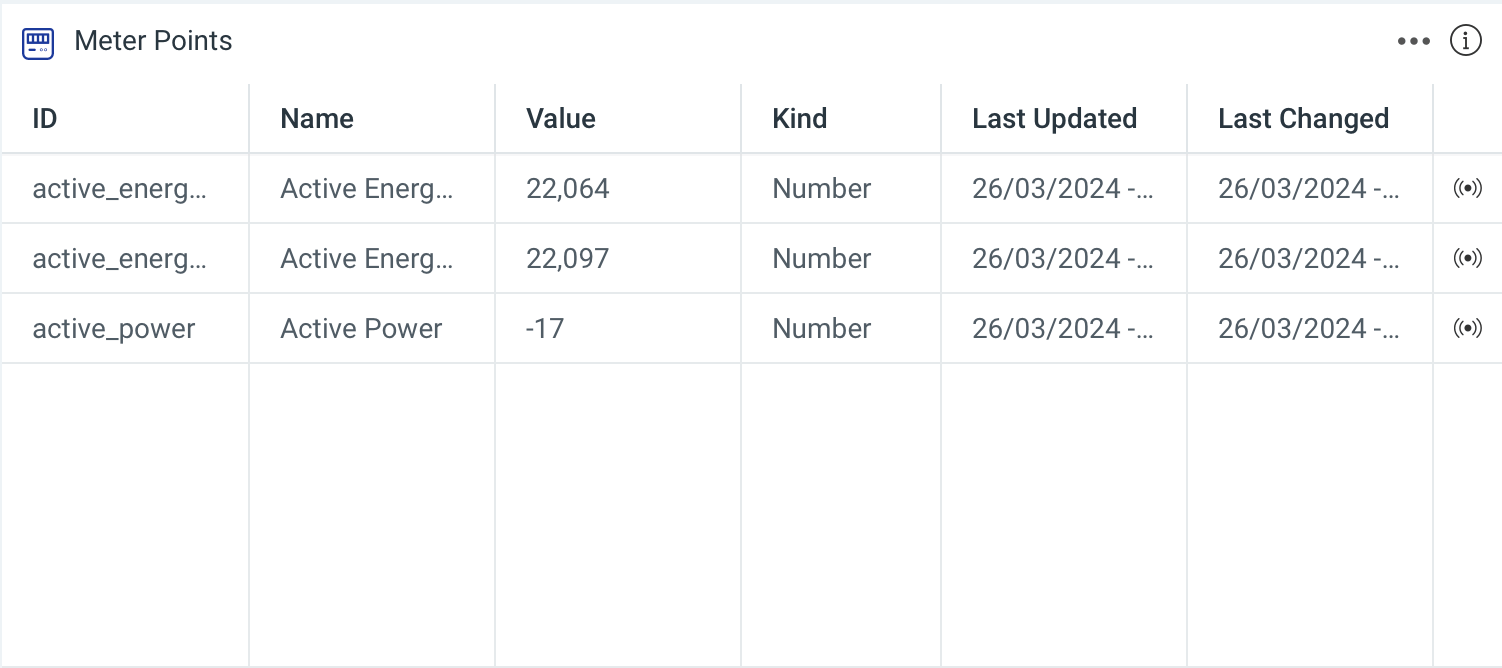
Need to view the latest values of your Points on a piece of Equipment? Good job we've added the new Equipment Points Table Widget, which allows you to do just that when added to any Dashboard. Users can see all of the Points that are associated with their chosen Equipment, along with their value, kind, the time they were last updated and changed, and whether or not the Point is time series enabled.
By using this widget, it's much easier to get a snapshot of what's going on with your chosen Equipment than ever before.
Equipment Template Widget
Ever wanted to create your own visualisations for your industrial assets? Using our brand new Equipment Template Widget you can do just that by combining your Equipment and Points with the Handlebars templating engine. The Equipment Template widget will unlock huge potential for users to create visually exciting and informative ways of representing their Equipment and Point information, completely tailored to organisational needs.
Reporting
The brand new Reporting module is a centralised place for reporting, and will store all reports across all modules of the Hark Platform. The module empowers users to view, manage and export their report data as a snapshot in time.
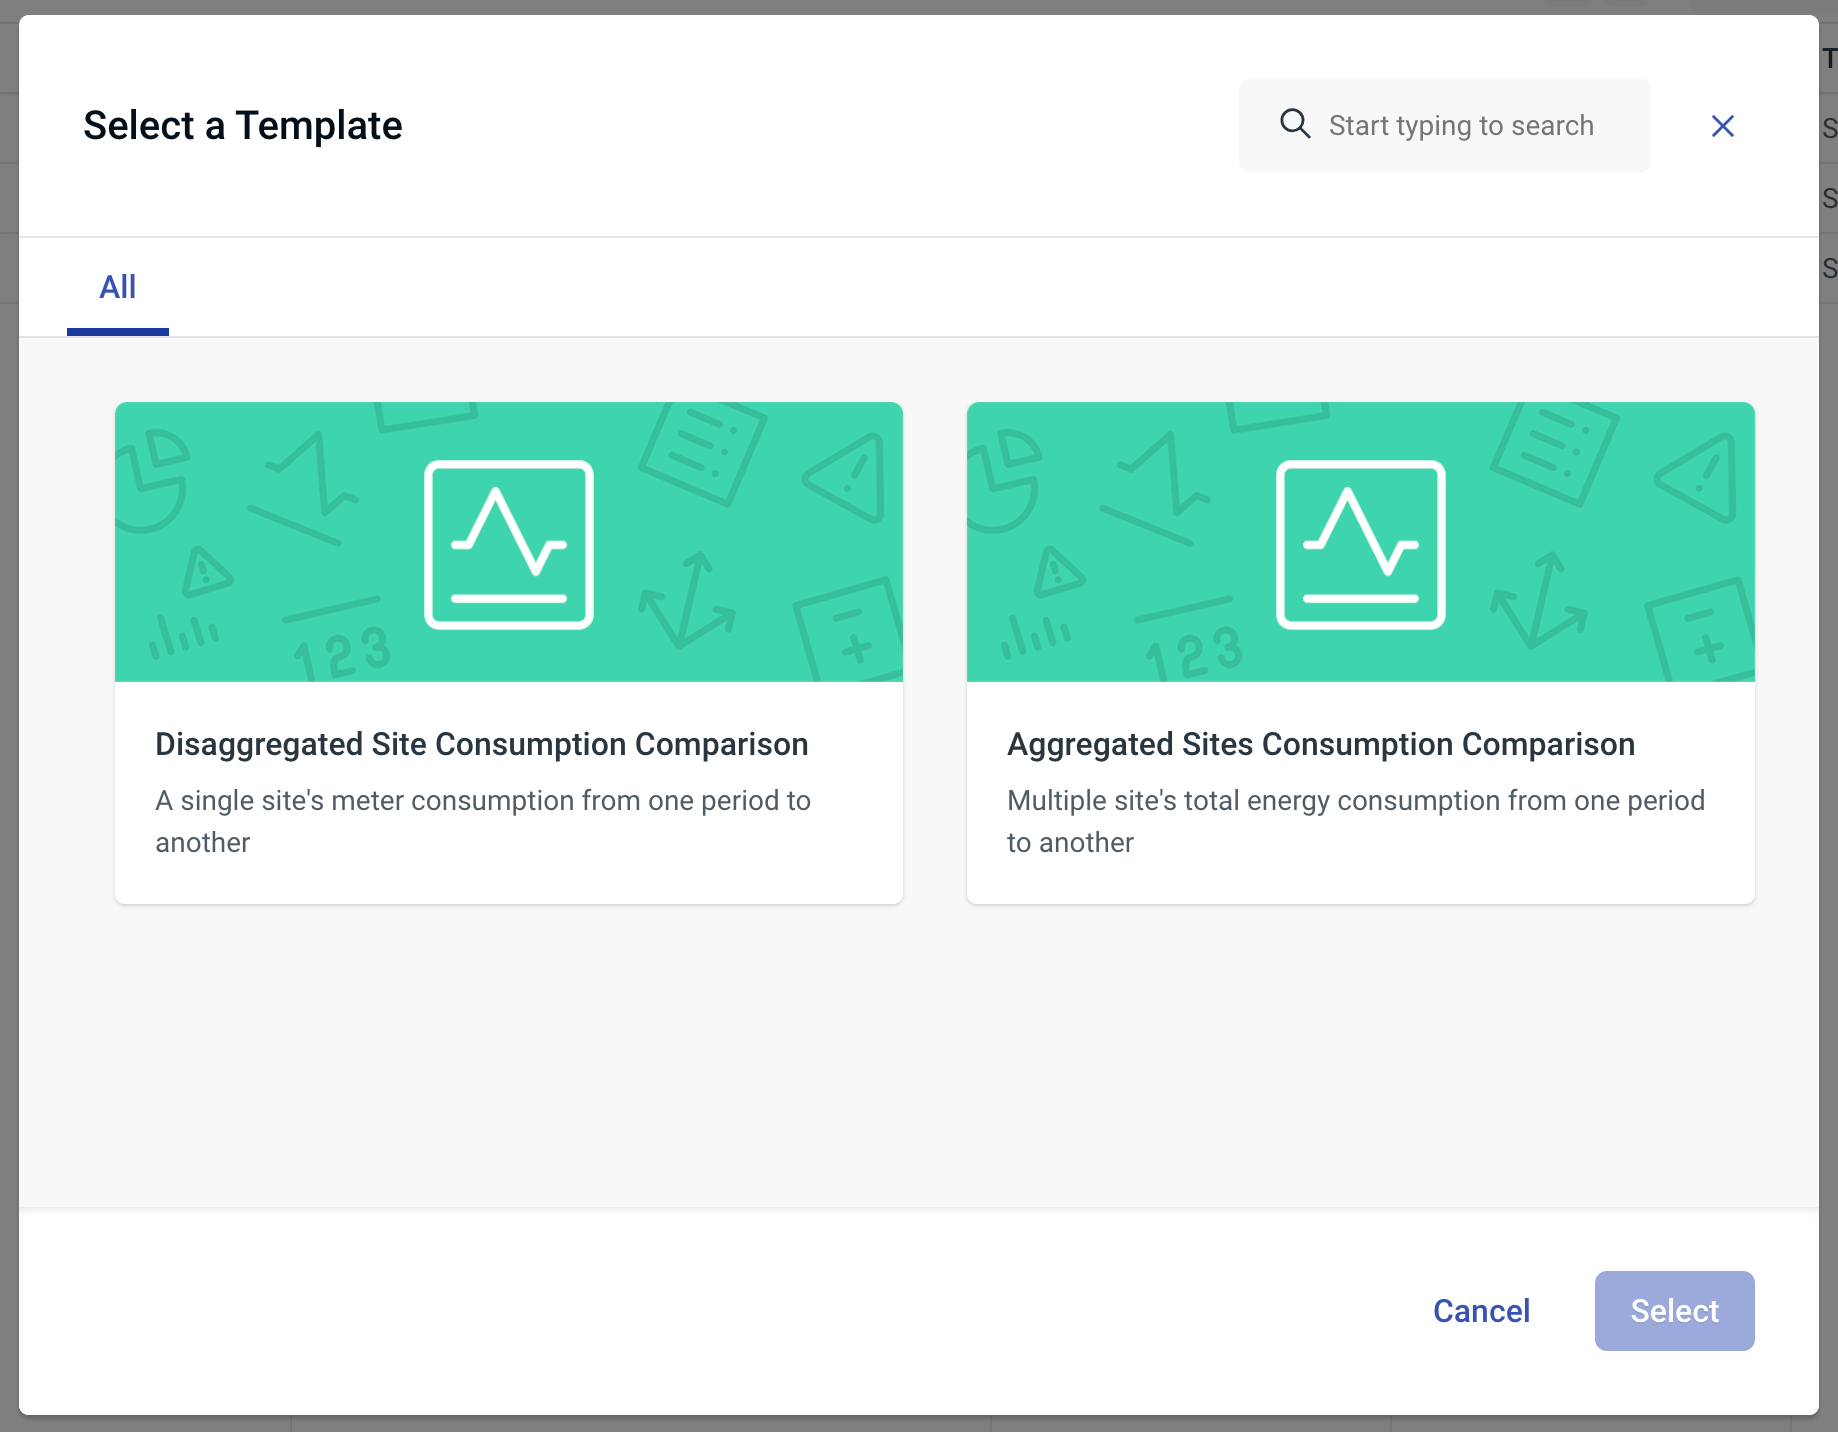
You can create a new report on your data using our pre-defined Report Templates in the Management area.
In this release, there are two templates available:
- Powered by Energy Tools data, users can create a Disaggregated Site Consumption Comparison Report, which compares a list of aggregated readings from all meters of a particular energy type at a single site.
- Also powered by Energy Tools, users can create an Aggregated Site Consumption Comparison Report, which compares total energy consumption (i.e. an aggregation of all the meters at one site) across multiple different sites.
We're currently busy working hard to add more report templates supported by other Platform modules (e.g. Explorer) - watch this space!
If you would like to see a demo of the Reporting module, or you would like more information, please don't hesitate to get in touch with us via the Hark website.
Energy Tools
We're excited to introduce significant processor updates in this release, bringing a new level of performance to Energy Tools. With these enhancements:
- Users can now install a meter during any time of the month.
- Users can now enter calculations for virtual meters at any point in the month.
- Data is now half-hourly profiled - meaning that Hark can estimate and calculate data down to the half hourly interval, even if the data being used is monthly data.
- Meter data is now processed an individual basis, for smoother and more efficient operation.
But it doesn't just stop there - these changes will unlock a vast amount of future functionality, for example creating and adding meters to the UI, as well as enhancements around calculations and estimations.