January 2023
We're kicking off the year with powerful user experience improvements and new data exploration features across Analytics, Twin Engine, Connect and Energy Tools!
Analytics
Group Hierarchy by Location Attributes
Last month we released the ability to manage Locations attributes, such as customer information, address information, anything that might be useful to you and your organization. You can read more about Location Attributes in our December 2022 Release Notes.
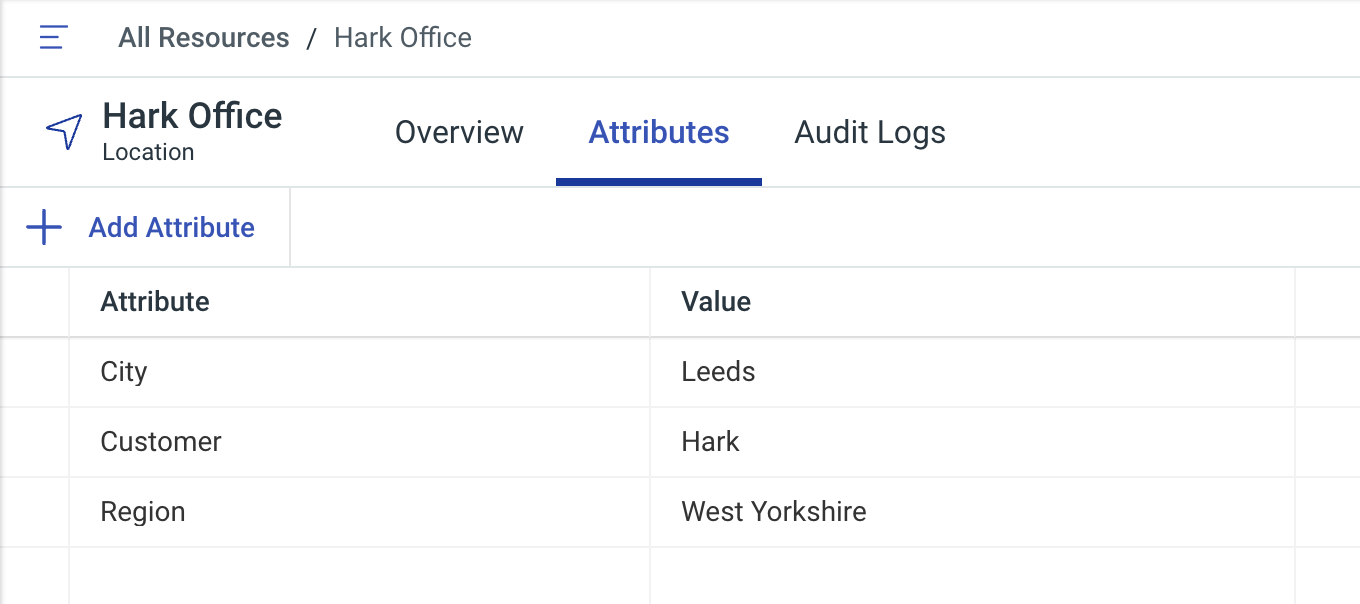
Today we're announcing the ability to group your Locations by the attributes you've added to your Locations, in the Hierarchy! You can group your Locations by Customer, Region, or any other attributes you've set on your Locations.
To group your Locations, ensure you've added attributes to your Locations, and click Group By and select the attribute you'd like to group by, and you're done - now your Locations will be grouped so that you can easily segment your Locations by what makes sense for you. As you manage and update your Location's Attributes, the Hierarchy will reflect your changes!
Twin Engine
Export Model Properties, Alarms and Events
It's often helpful to be able to get your data out of other systems and in to tools such as Excel, and today, we're allowing you to do just that. When viewing a Model's Properties, Alarms or Events, you can click export to get the data you're currently viewing out of the Hark Platform as a CSV.
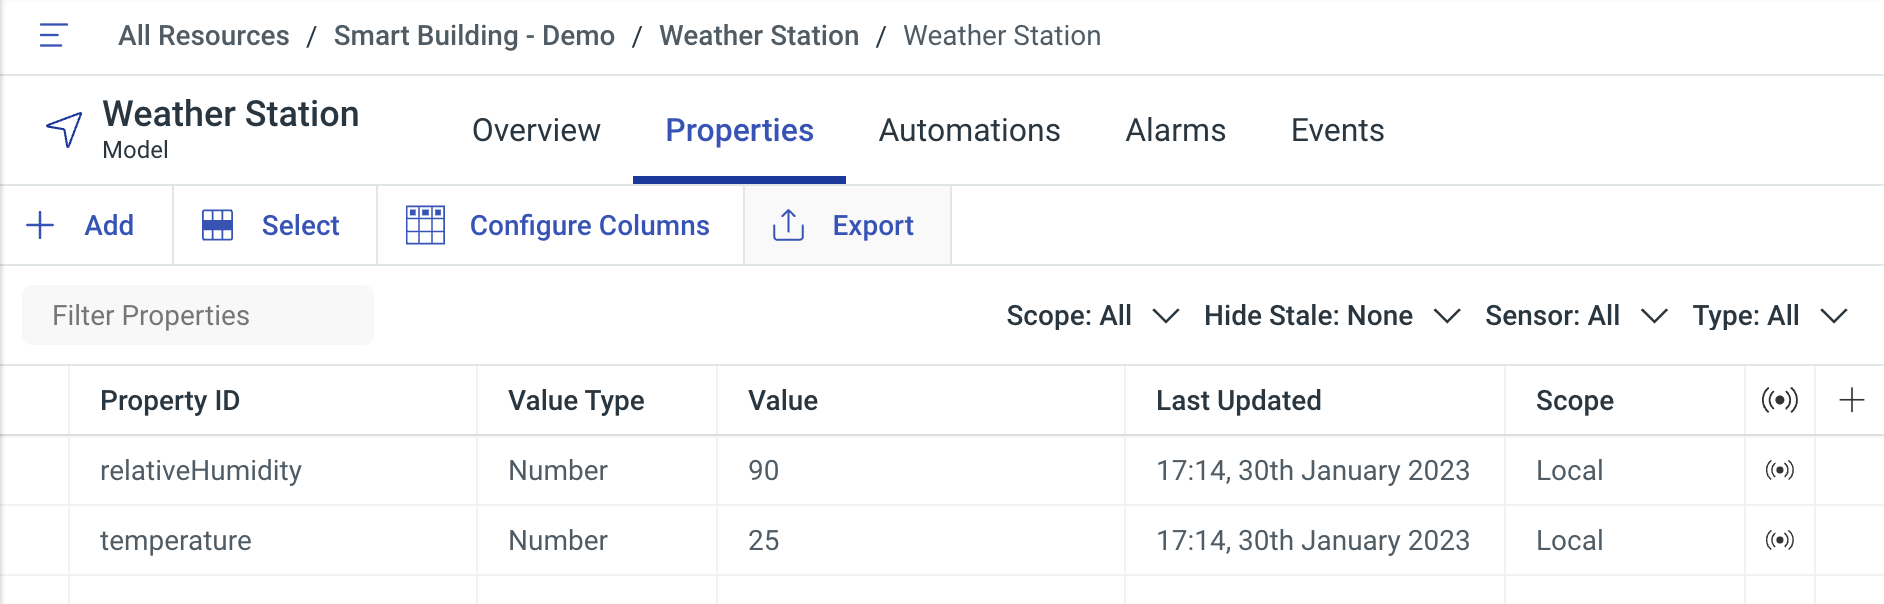
When exporting Properties, Events or Alarms, your active filters and time ranges will be used as filters for your export. Configure the export you want, click export, and you'll have the data you need!
Events Widget Filters
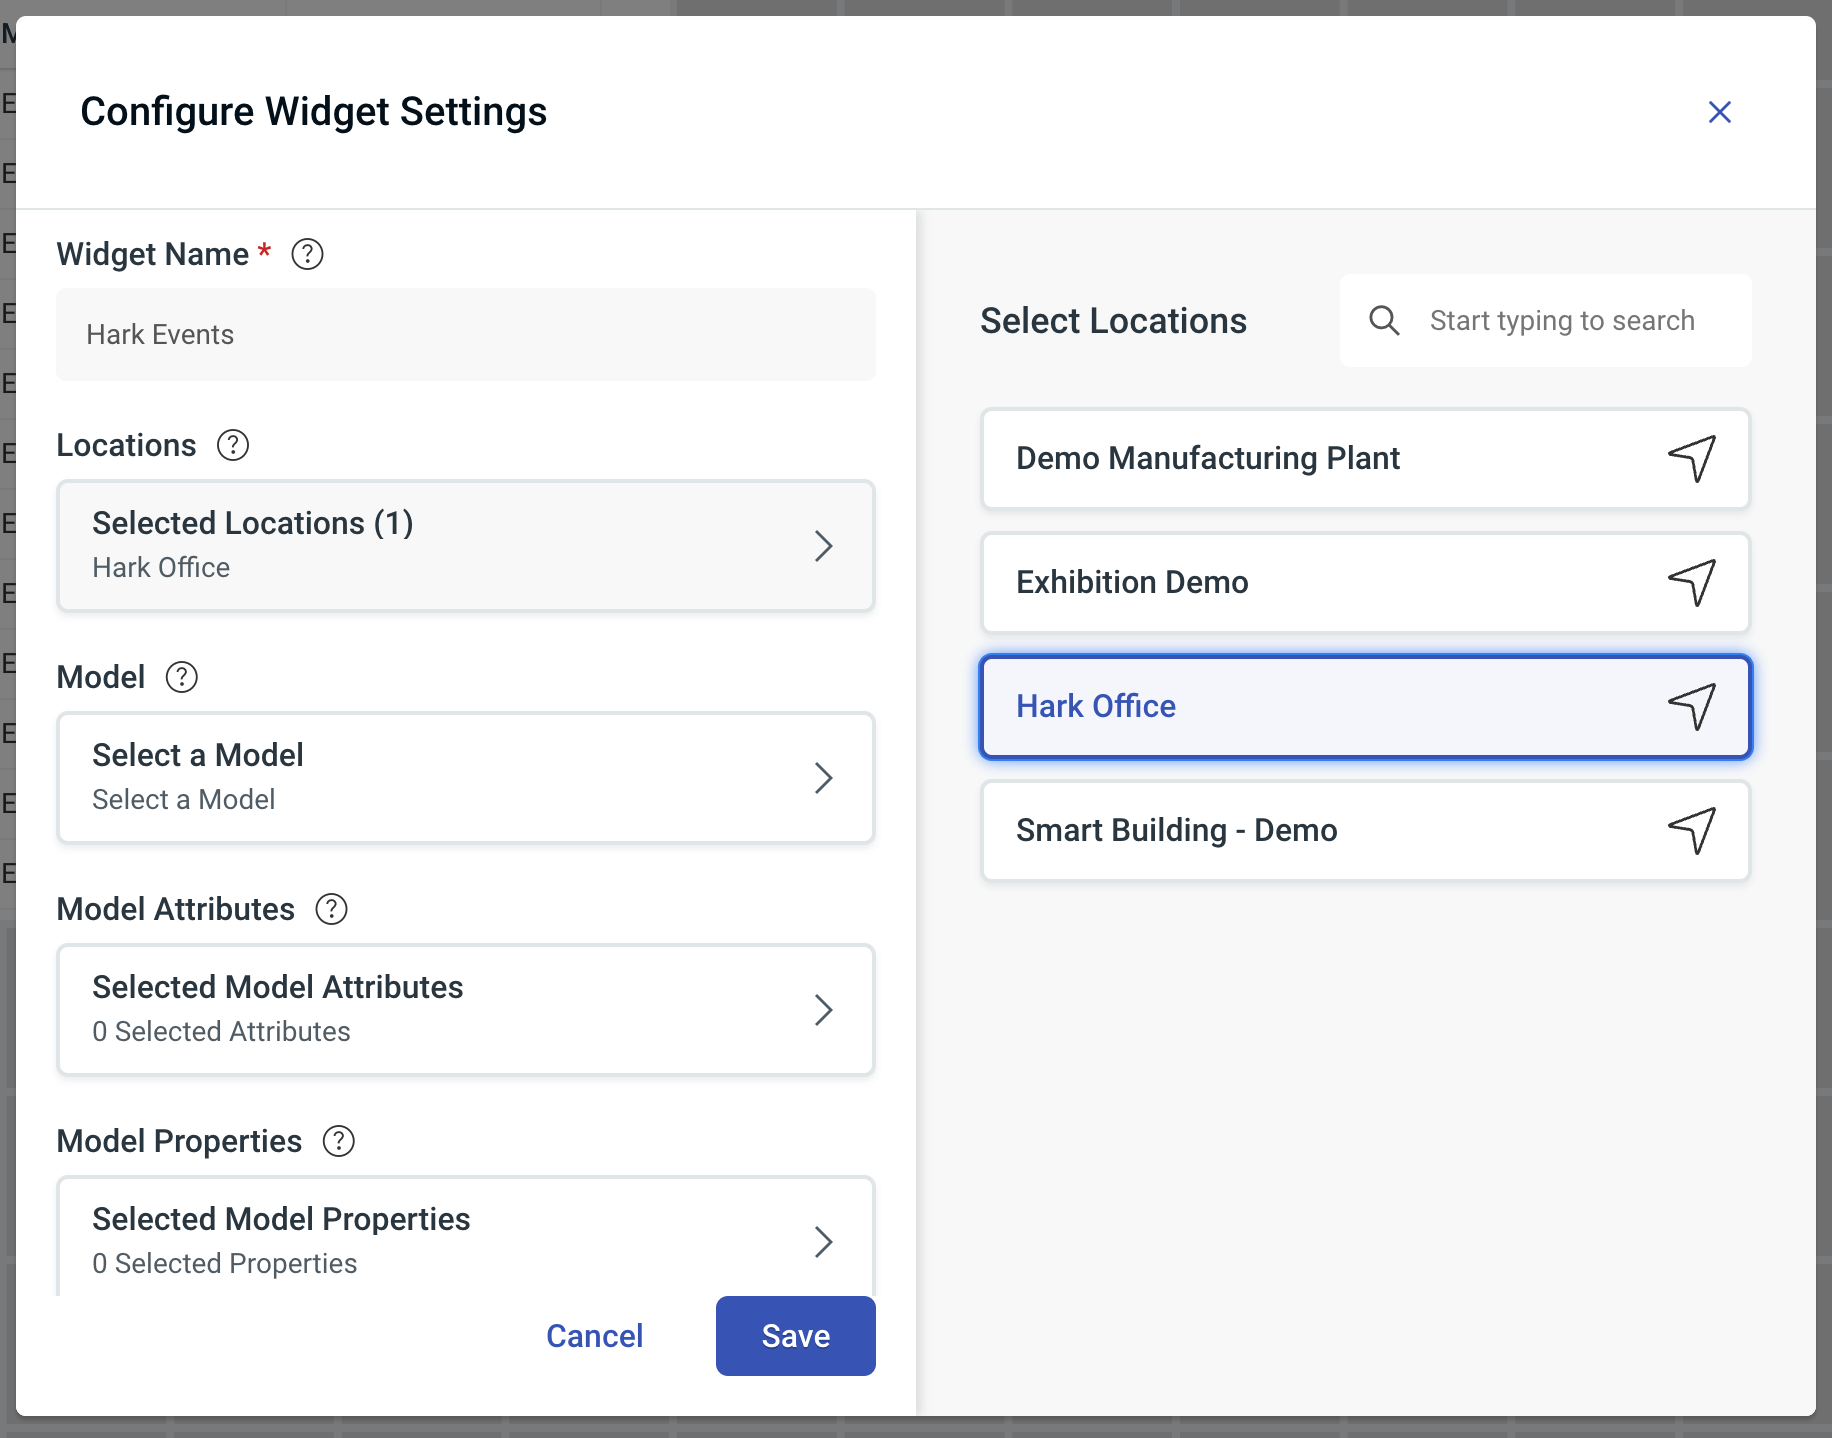
The Events History Table widget now feature the ability to filter the returned events to specific Locations, Model Property values and Model Attributes to help you filter the Events you need to see, at a glance. You can see all of your Events across a Location, or all of the Events for a specific type of asset across your entire organization.
Alarm & Events Attributes Tables
We've updated the Alarm and Events attributes details views to present their data in a table format to improve readability for our users. The new structured tables help users quickly scan and understand the data on their Alarms and Events
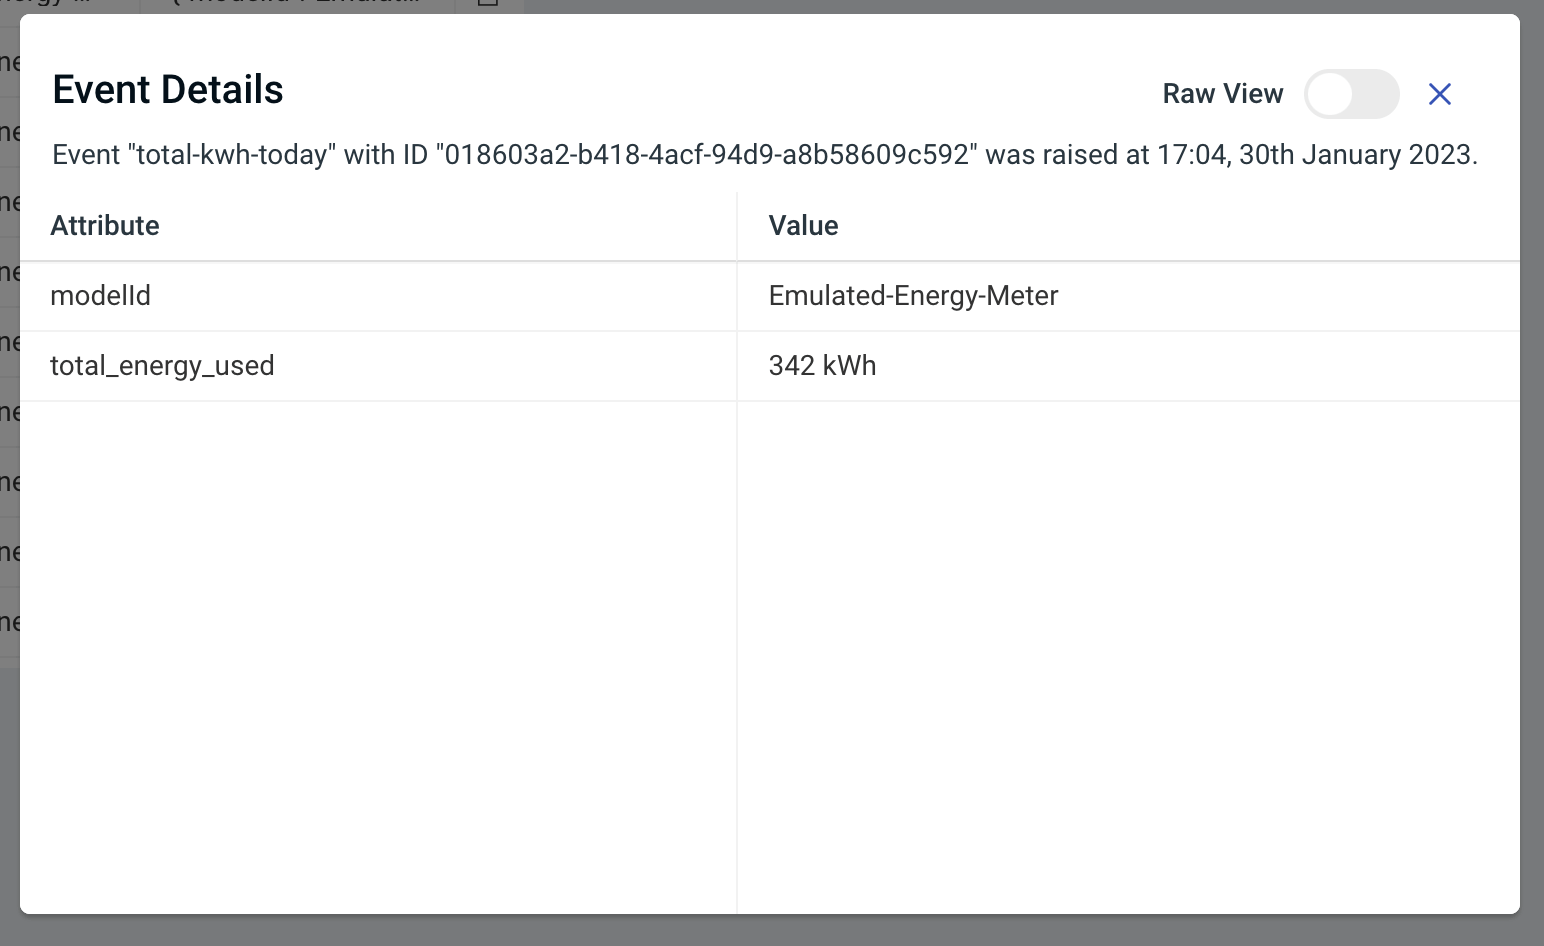
You can also use the View Raw toggle to view the data in the original JSON view if you need!
Connect
View Model Link & New Overview
When viewing an Adapter, you can now see a brand new Overview tab which details more information about the status of your Adapter, and what it is configured to do. Each configured group features the same status information you're used to, such as the overall status, any error information, duty cycle and now a brand new description to help you identify which device or asset you're pulling data from.
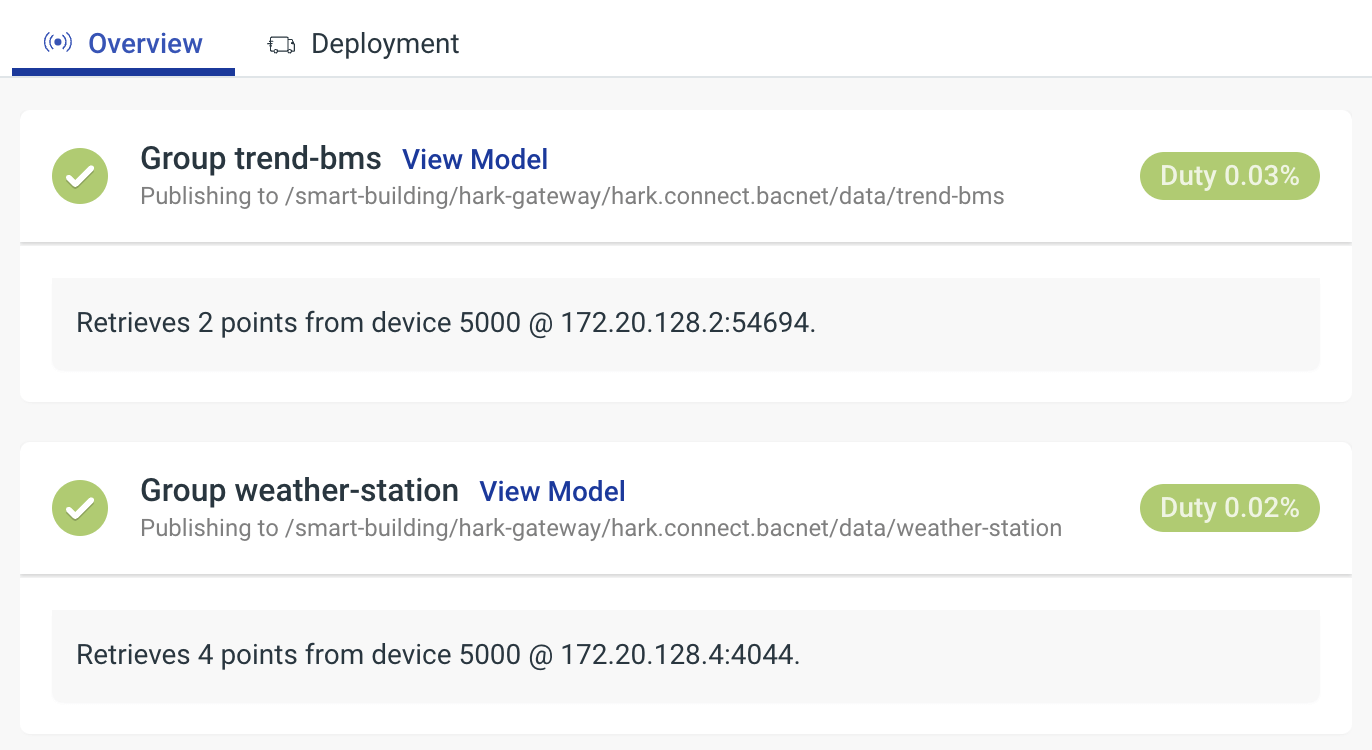
We've also added a View Model link to each group to help you quickly navigate to the Model that has it's data being powered by the configured group on an Adapter. Clicking View Model will take you straight to the Model to see the groups data in real-time.
Energy Tools
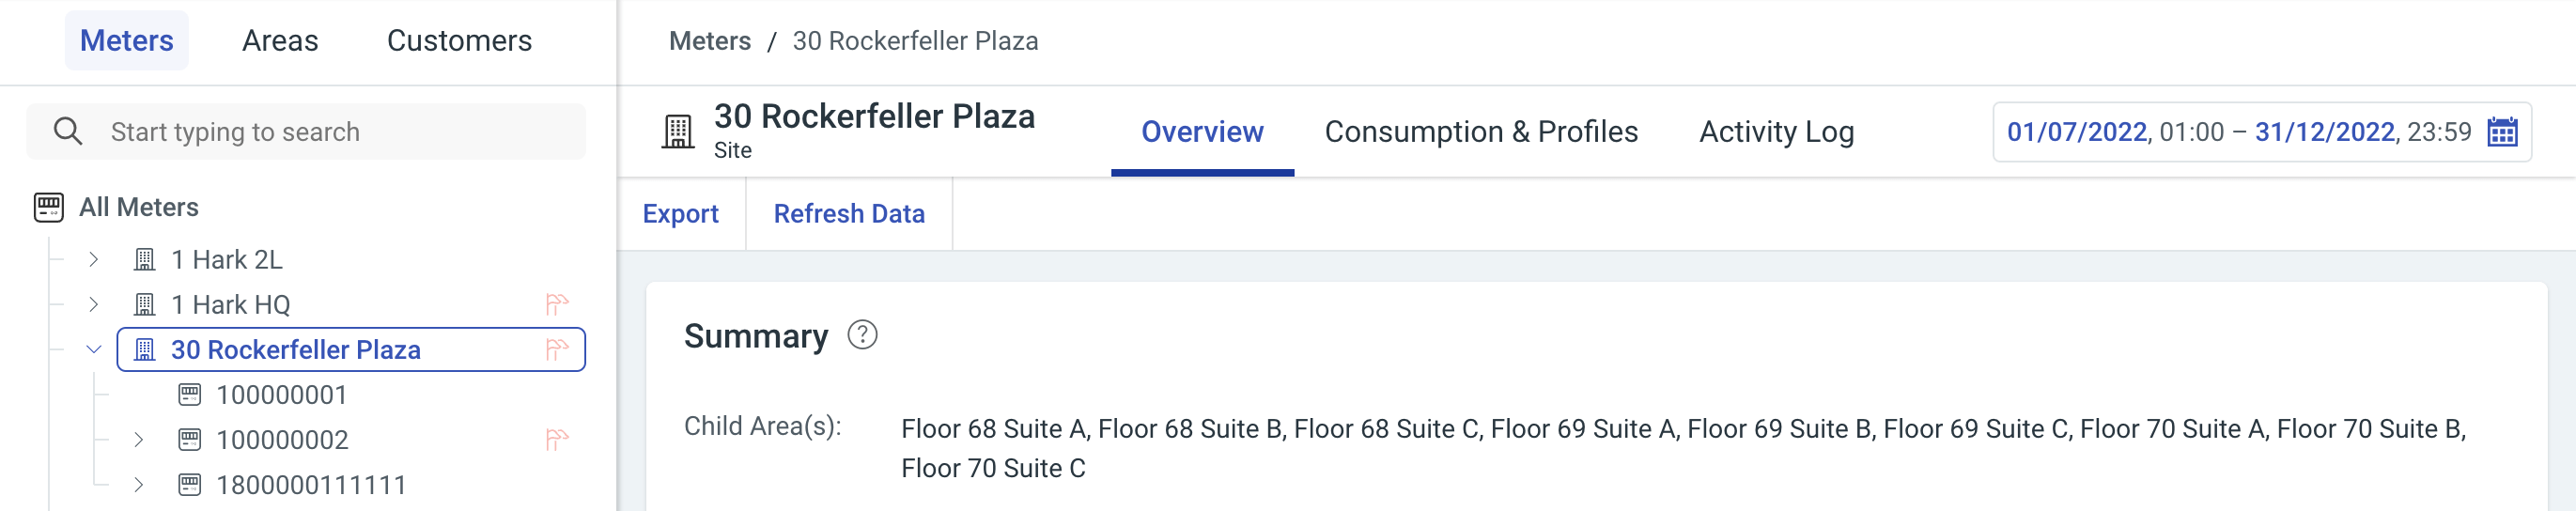
Meter Descriptions
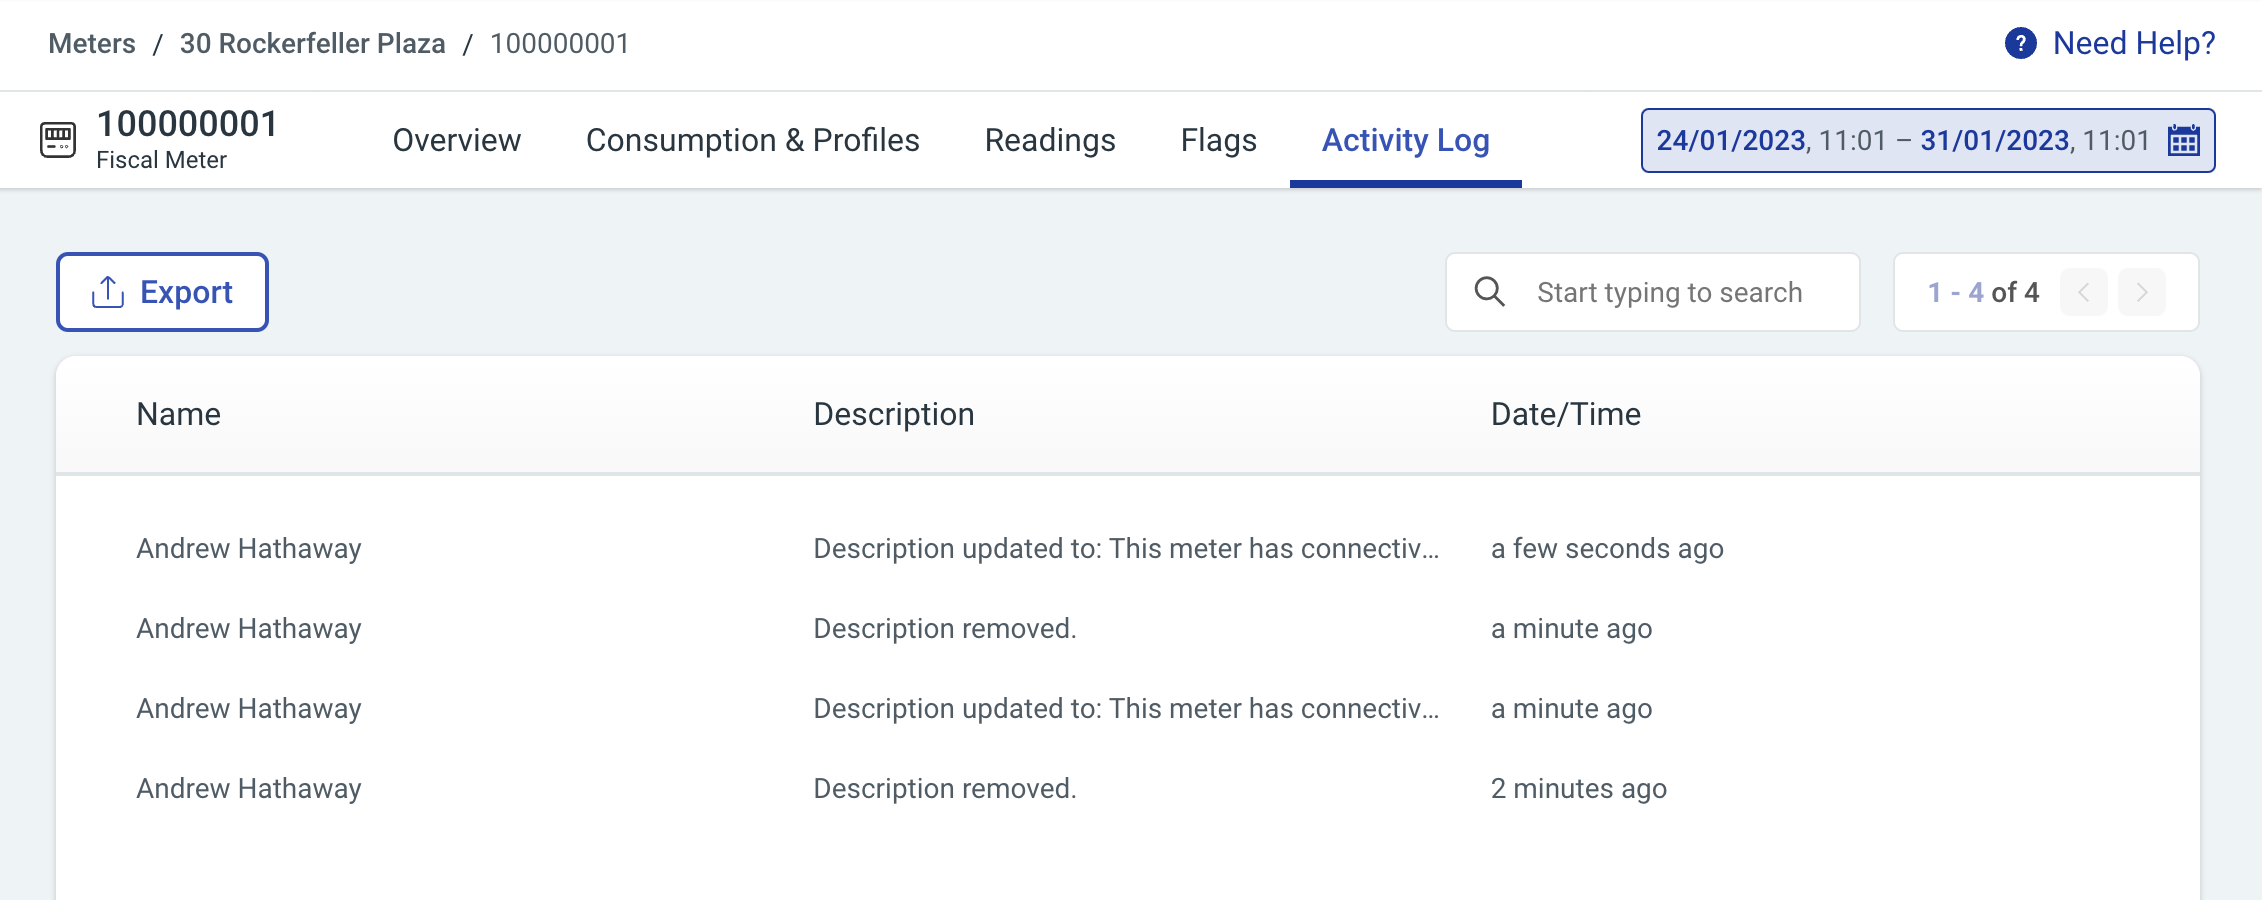
You can now add a meter description to provide other Energy Hierarchy users with some context to the meter they’re looking at. To do this, navigate to the meter point through the hierarchy and click “Add Description”, from here you can enter up to 100 characters, which will be displayed on the Meter’s Overview Summary to help add context for your colleagues.
Once a description has been added, you can update the description by clicking “Update Description” to either amend or remove that description. Any added, updated, or removed descriptions will be logged in the Activity Log for any auditing purposes.
User Experience Upgrades
Hierarchy User Interface
This month we're releasing some updated user interfaces for Energy Tools with the main goal of improving our users ability to see the information they need to see quickly and ultimately increase the efficiency of their day to day work.
When using Energy Tools, you'll see a more compact navigation menu and command bar to ensure focus on the information that is most important. We'll be continuing to make more updates to the user interface of Energy Tools in the coming months as we continue with our goal.
Improved Flags Navigation
When performing data validation using our Flags system you often need to investigate a meters energy consumption to resolve any issues. Now when viewing your flags you can navigate directly to the Meter for a flag by clicking on the chevron icon in the row!
When viewing a Meter, you can quickly view any Flags using the Flags tab in combination with the date range picker to help narrow down the flag you're investigating.