February 2023
In February, we're working behind the scenes to power our next major set of functionality in the Hark Platform. In the meantime, we're releasing some great additions to the Twin Engine and Energy Tools.
Twin Engine
Models Map Widget
You can now plot your assets physical locations on a map within the Hark Platform by using our new Models Map Locations widget. You can configure the widget to show a specific set of Models or query for Models that match a set of given criteria. We also support a Streets, Outdoor or Satellite map styles.
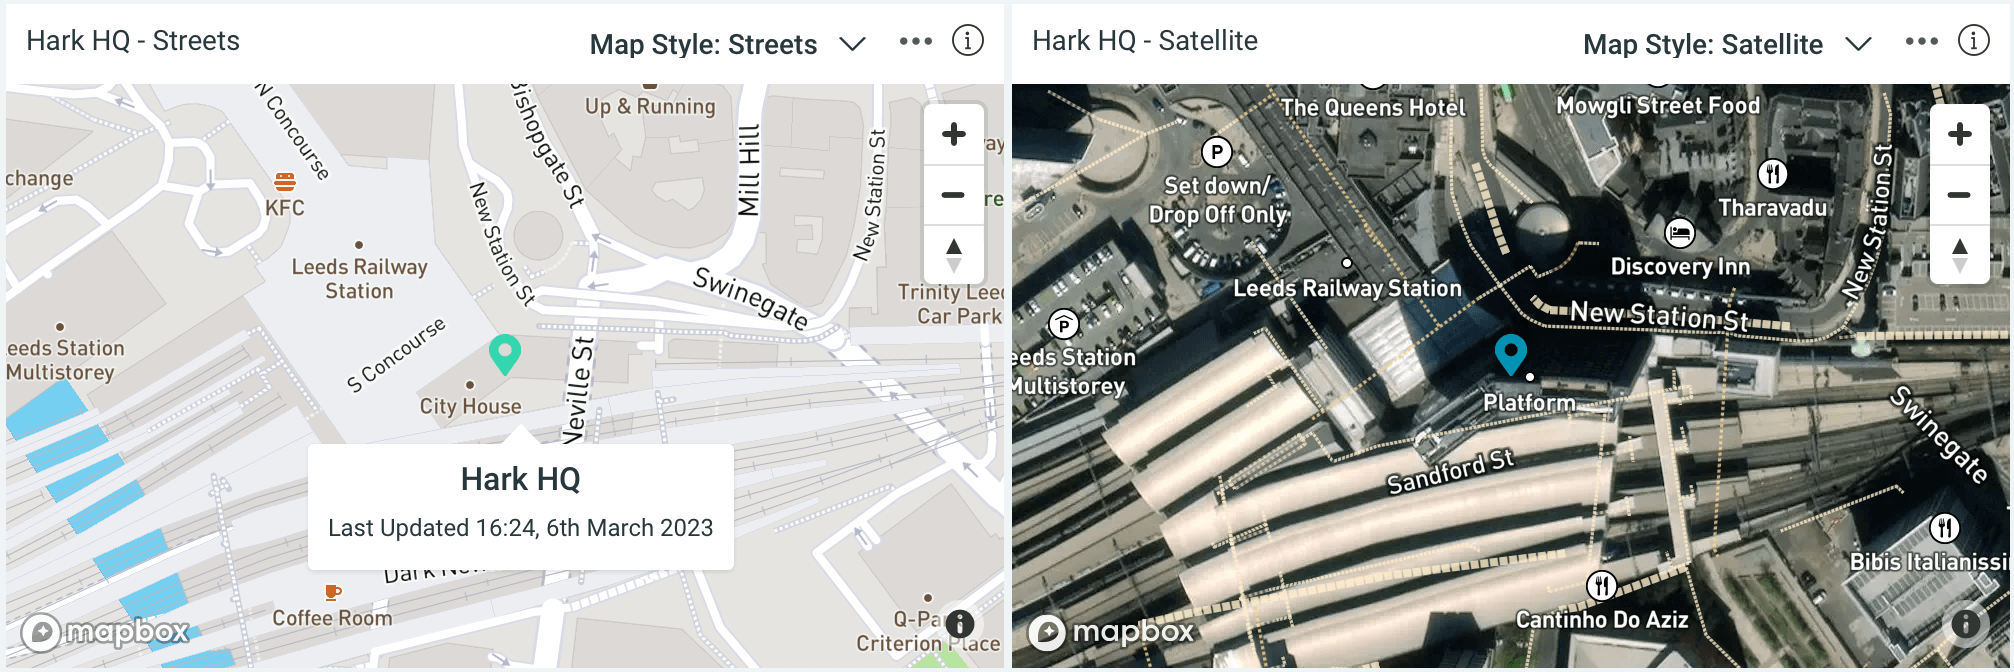
When configured the latest location for your models will be marked on the map, and by clicking on a marker you'll be able to see the latest information for your model. You can also change the map style at any point using the handy Map Style selector on the top right of the widget.
Energy Tools
Half Hourly Reading Import Format
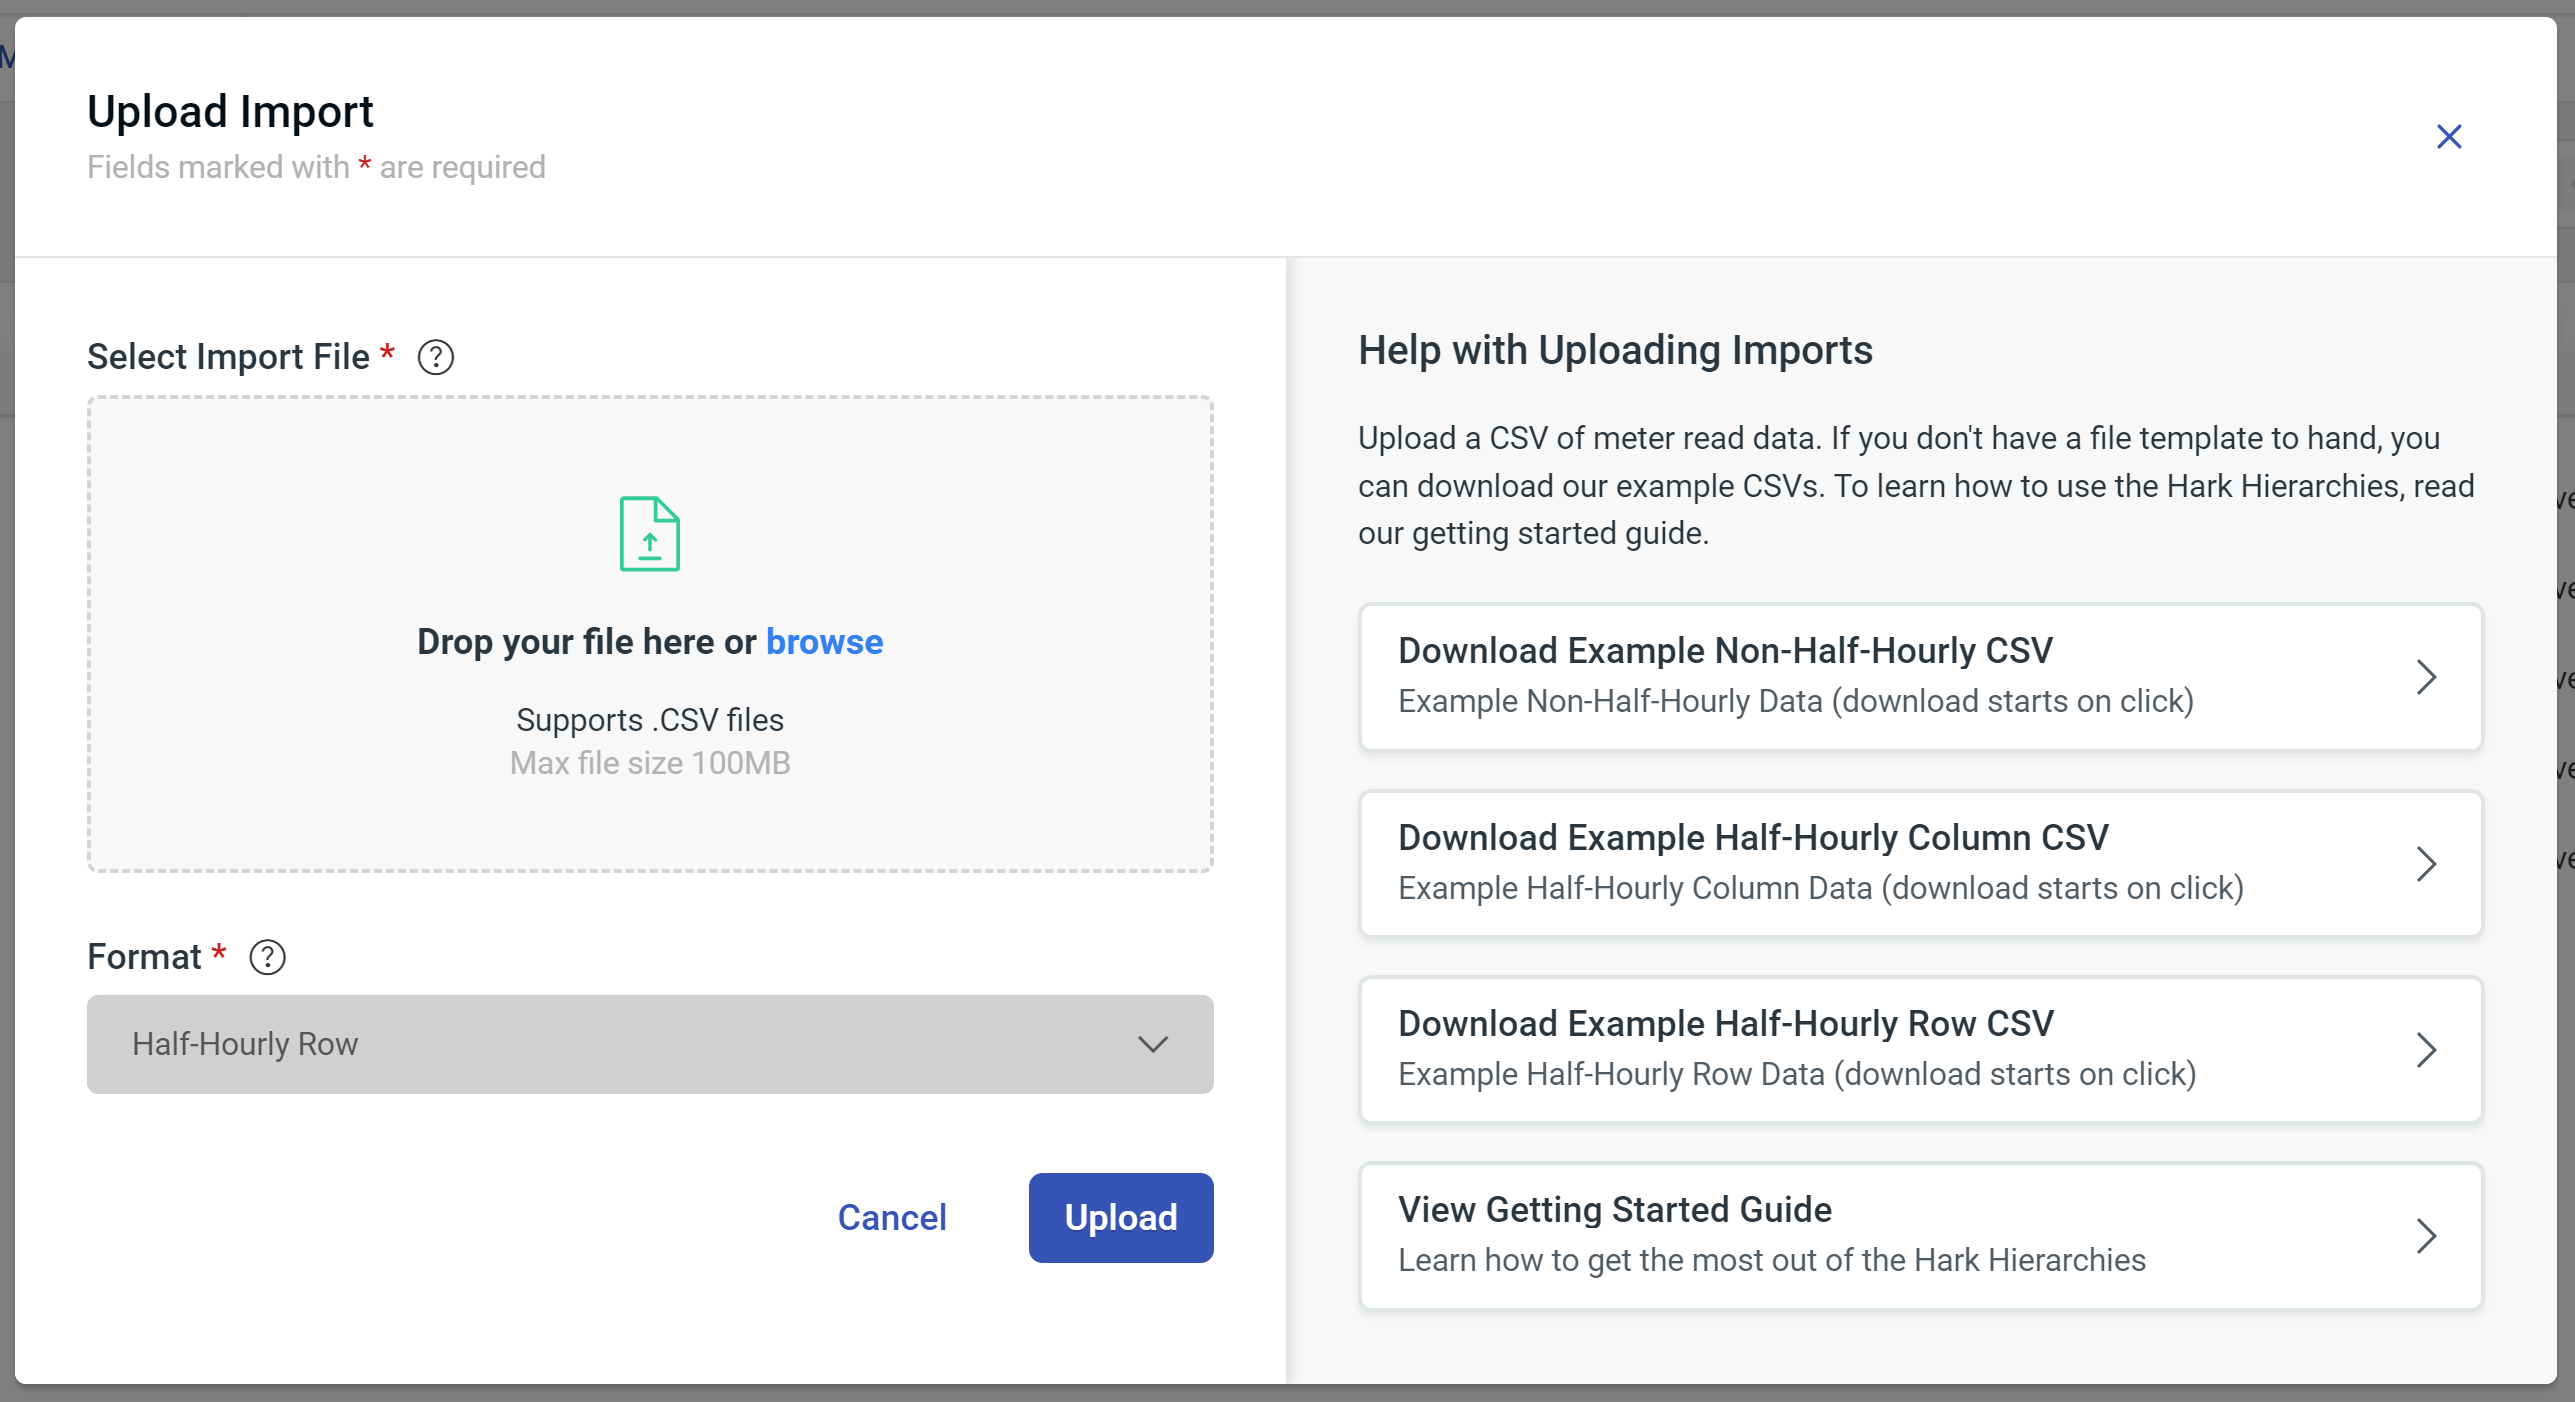
Energy Hierarchies now supports half hourly data uploads from Data Collectors, which tend to use a row format, in the Imports page. To utilise this new format, go to Energy Tools and click Imports. Using the "Manual Import" button, from here select "Half-Hourly Row".
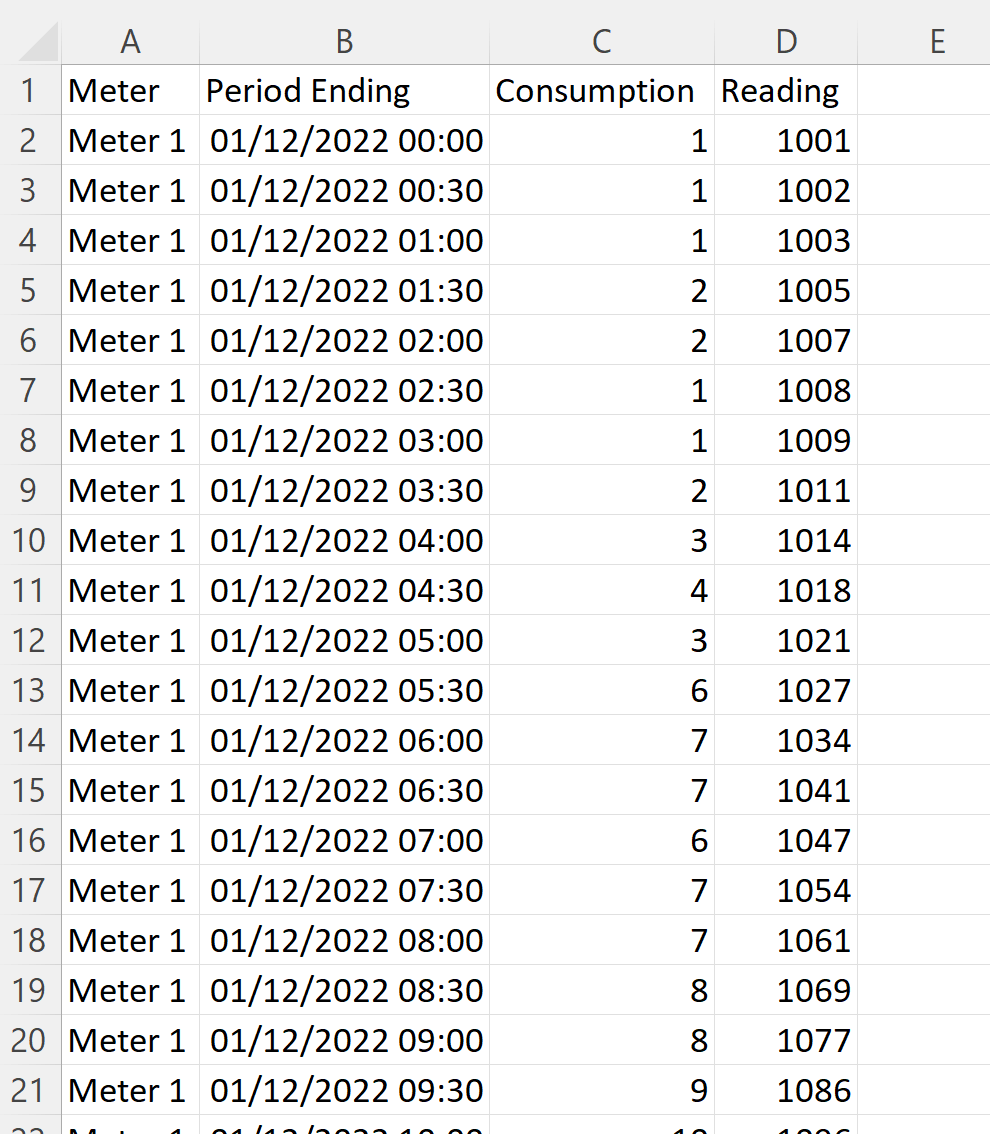
This new row format consists of each row representing a period within a day, specified by the date provided:
- Meter - The meter's serial number (required)
- Ending Period - The date that the meter readings were taken (required)
- Consumption - The consumption value over the period specified (optional)
- Reading - The meter's reading value over the period specified (optional)
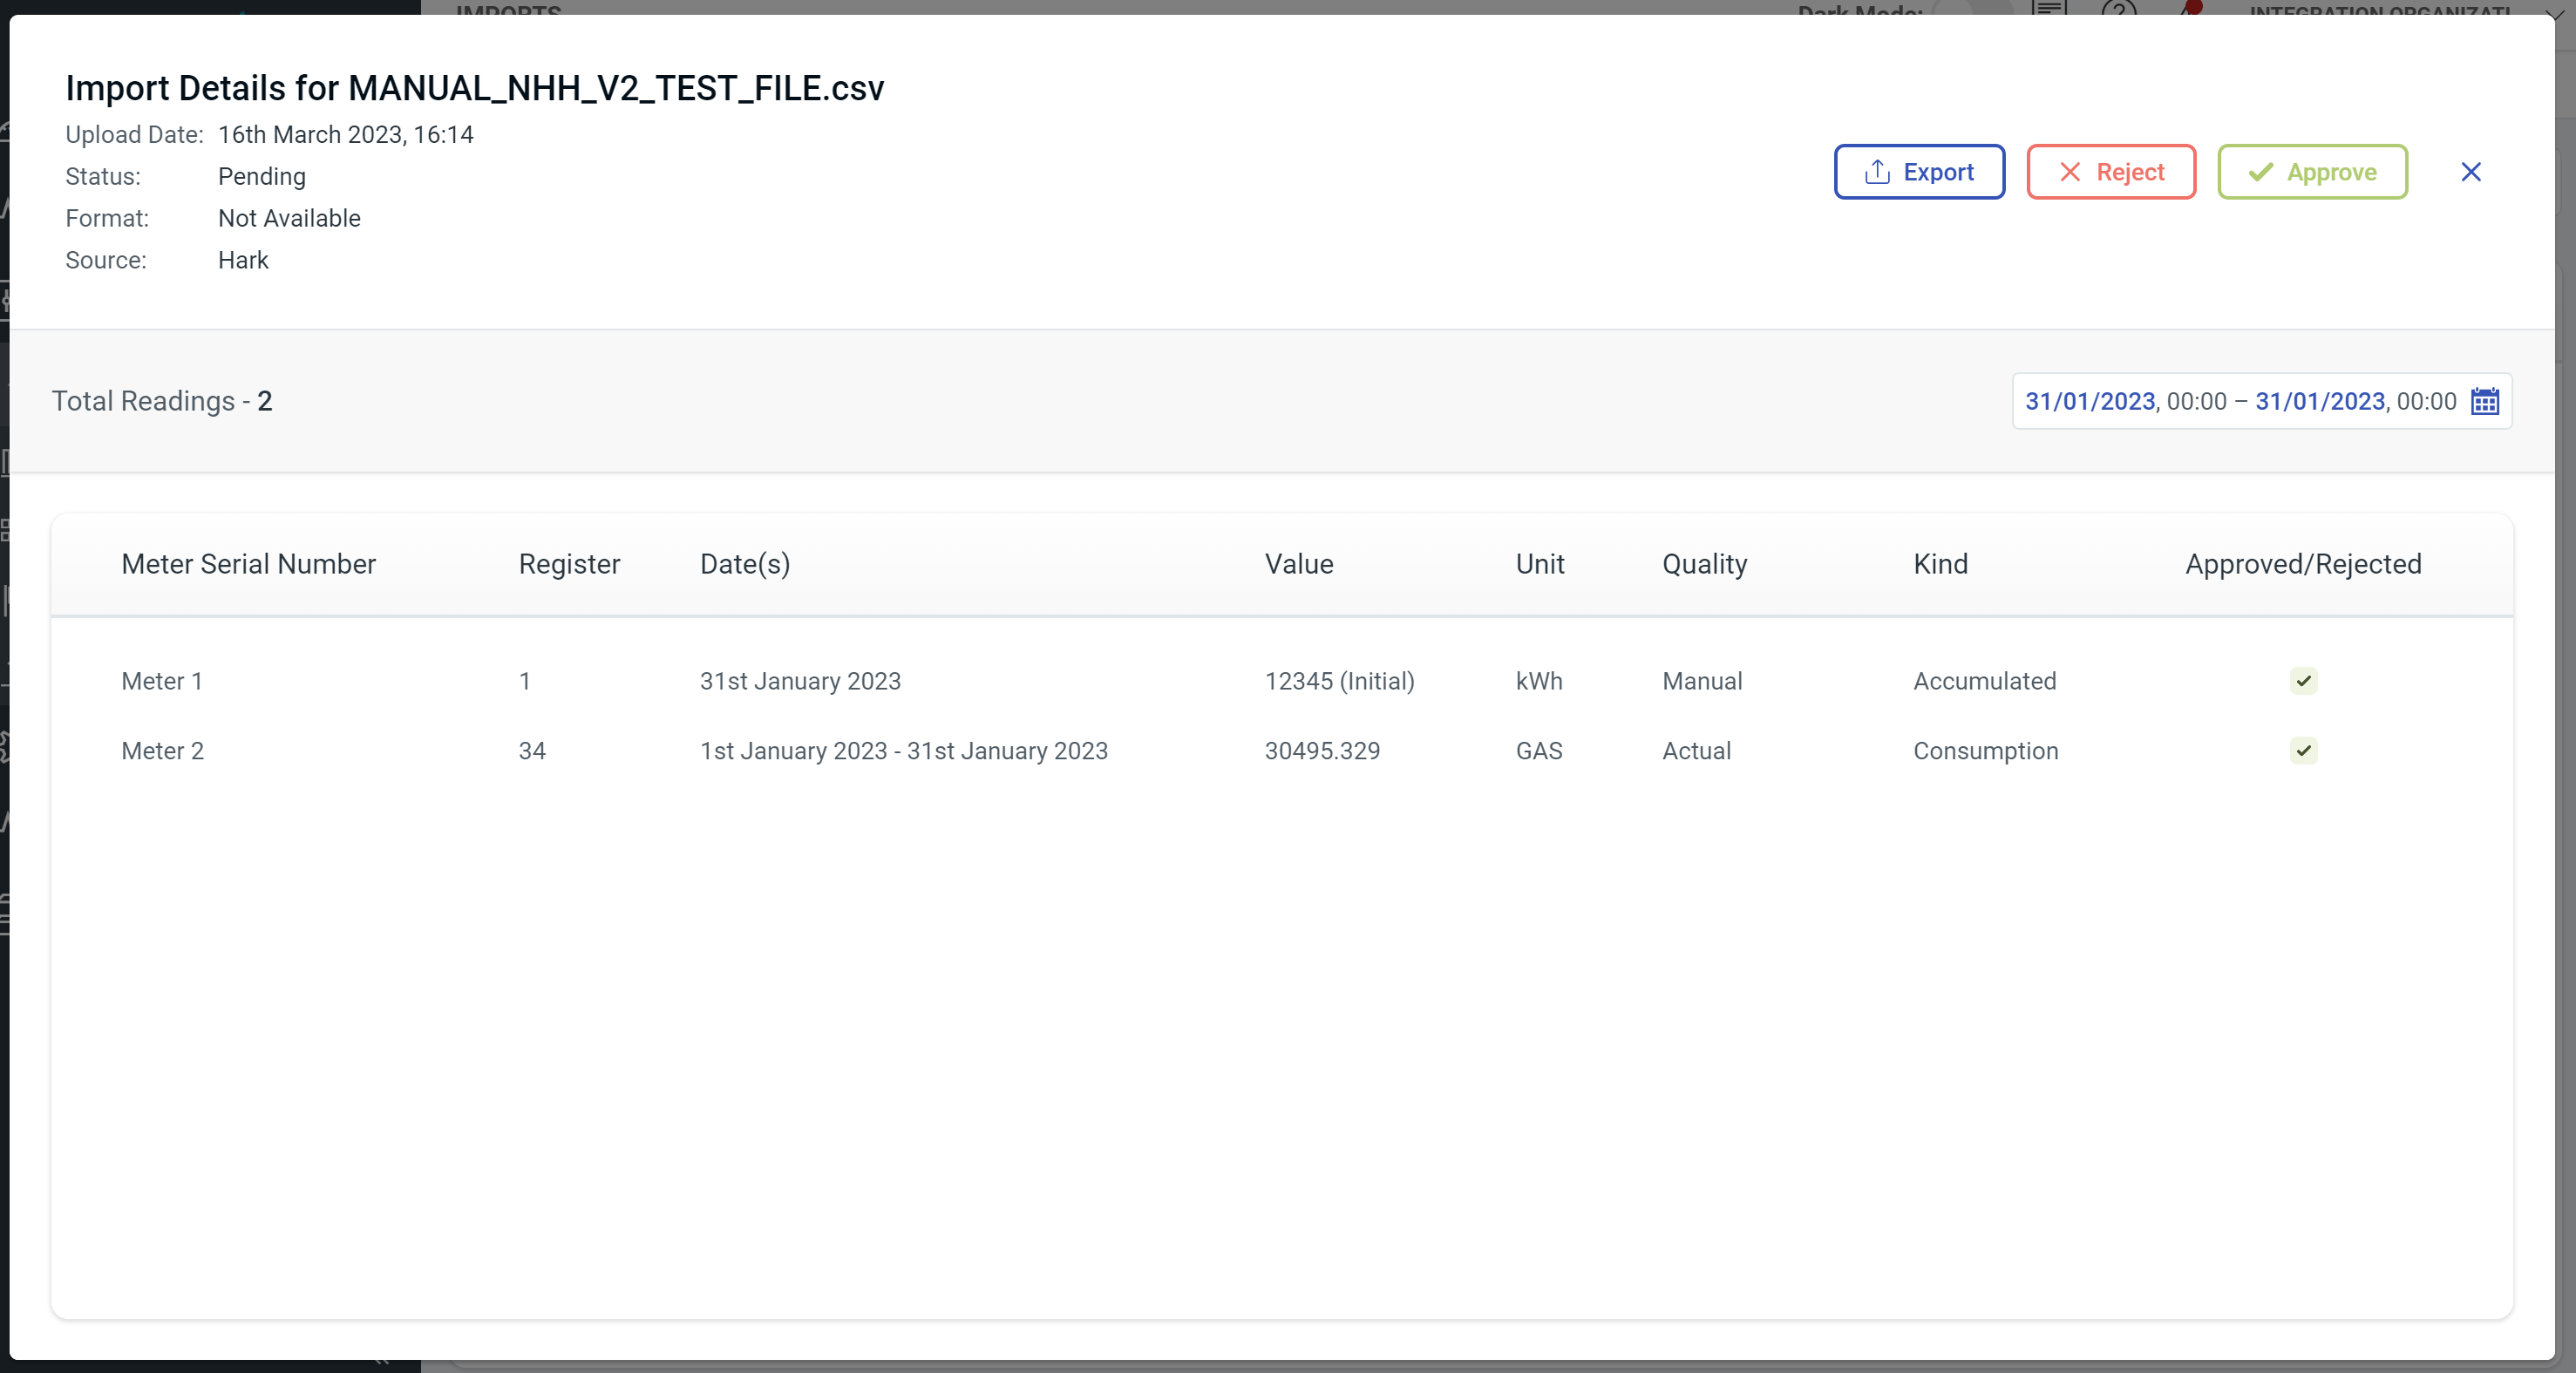
Once uploaded, the data will be processed and can be used in the Hierarchy's consumption once it has been accepted by clicking on the import in the Imports table and clicking "Accept".
Performance Improvements
Alongside the new half hourly row import formant, we've also added some bug fixes to improve loading speeds and data handling. We're also working hard to upgrade our charts and graphs, which will unlock unlimited potential to add new features in the very near future!