July 2020
In July we’ve been working hard to release some brand new features to Energy Tools, as well as releasing our new Loss Prevention module. To check out more information regarding those changes, see the Module Release Notes section below.
Loss Prevention
Today we’re releasing our brand new Loss Prevention module. If you’re in the retail business you’ll know all about shrinkage.
Our Loss Prevention module allows companies to understand their shrinkage and provide measurements on what products are most often stolen, how much money was lost due to shrinkage, what are your worst and best days shrinkage, and much more!
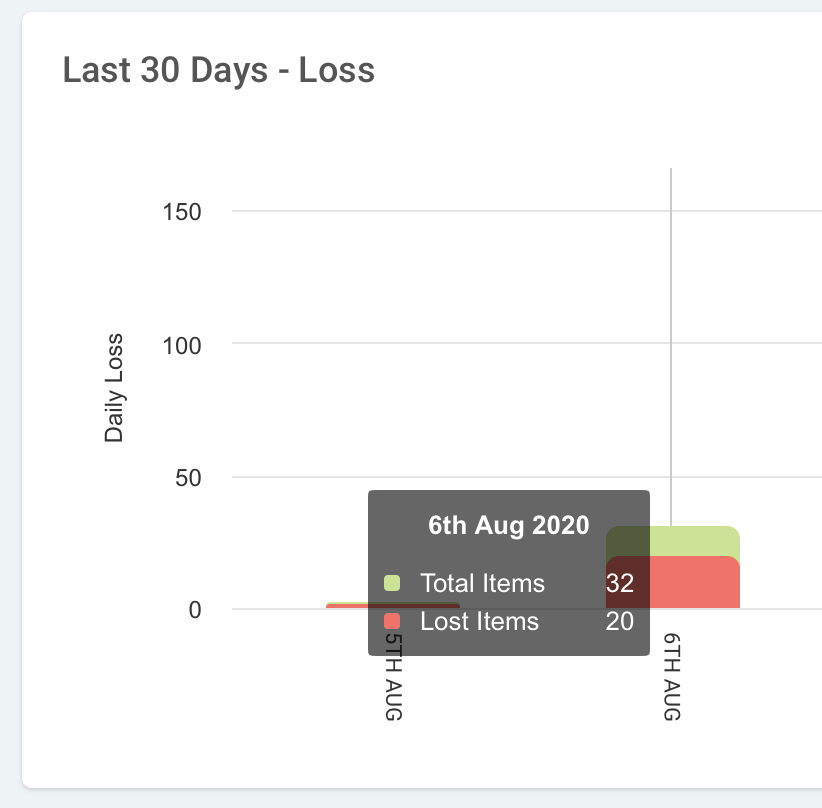
Setup a Point of Sale and start tracking your shrinkage today. You can get a day by day breakdown of how many items were lost compared to the total amount of items through a point of sale.
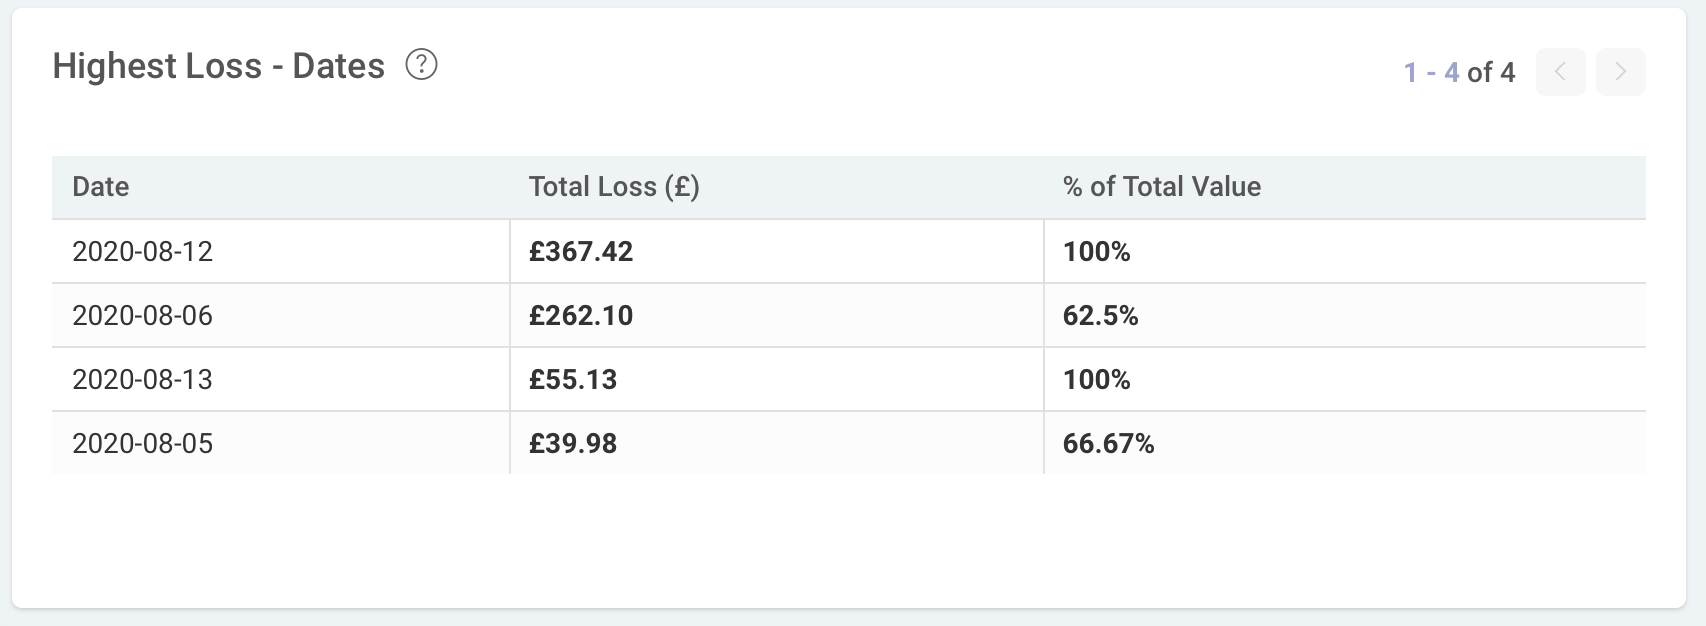
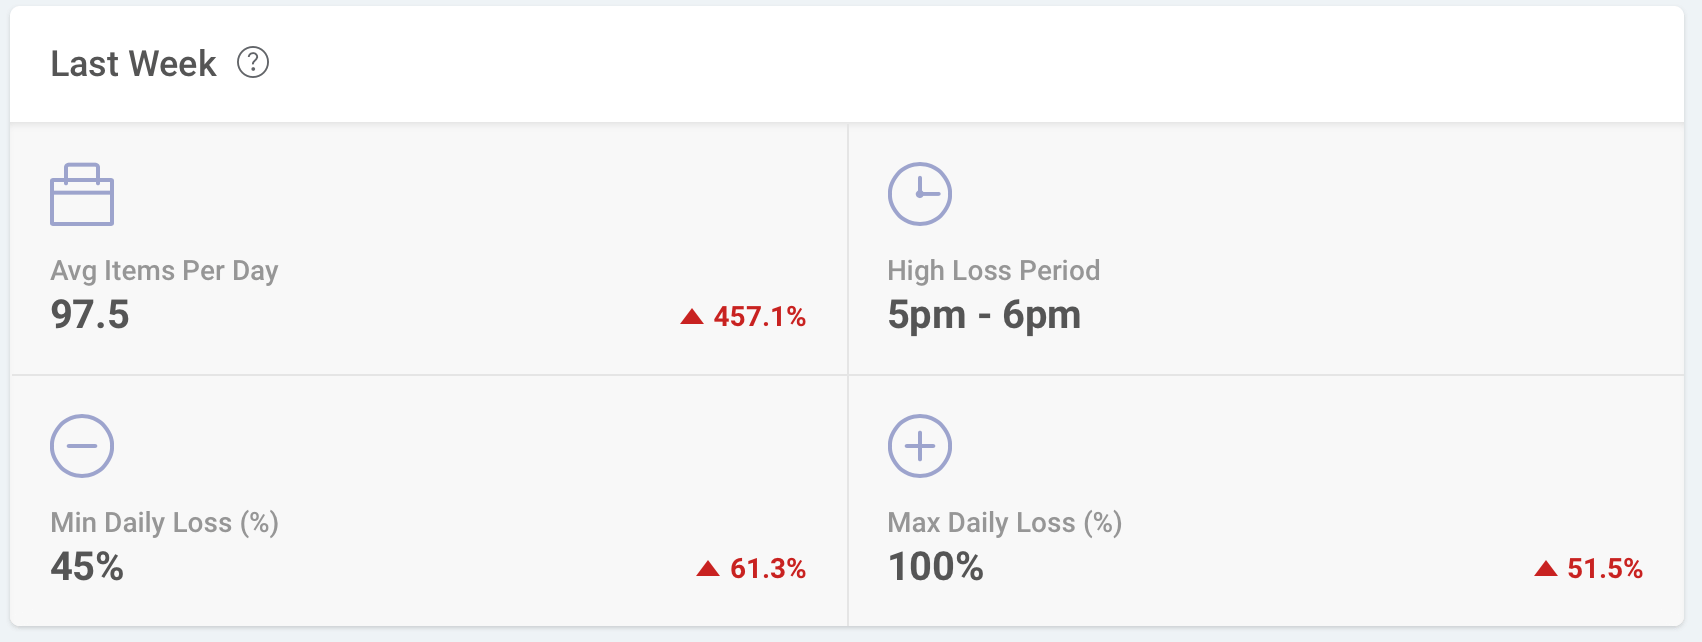
Or even track your shrinkage at a higher level on a per-location basis, and understand what your loss looks like over a 7 or 30 day period. What to know what your worst days for loss were and how much that cost you? Easy!
You can find out more about our Loss Prevention technology and chat to us about it today by visiting the Loss Prevention page on our website.
Energy Tools
In July we’ve added the zoomable graph functionality to the Dataset and Meter views consumption profiles! If your dataset is large and you want to zoom in for further detail, you can do that now!
We've also made fantastic improvements to the Forecasting features from last months release which you can use right now. These changes improve the existing functionality and adds more information and insight in to the forecast you've created.