June 2019
In Junes Hark Platform release, we’ve delivered some user experience updates for Custom Dashboards, export improvements and a fair few bug fixes!
Custom Dashboards Widget Selection
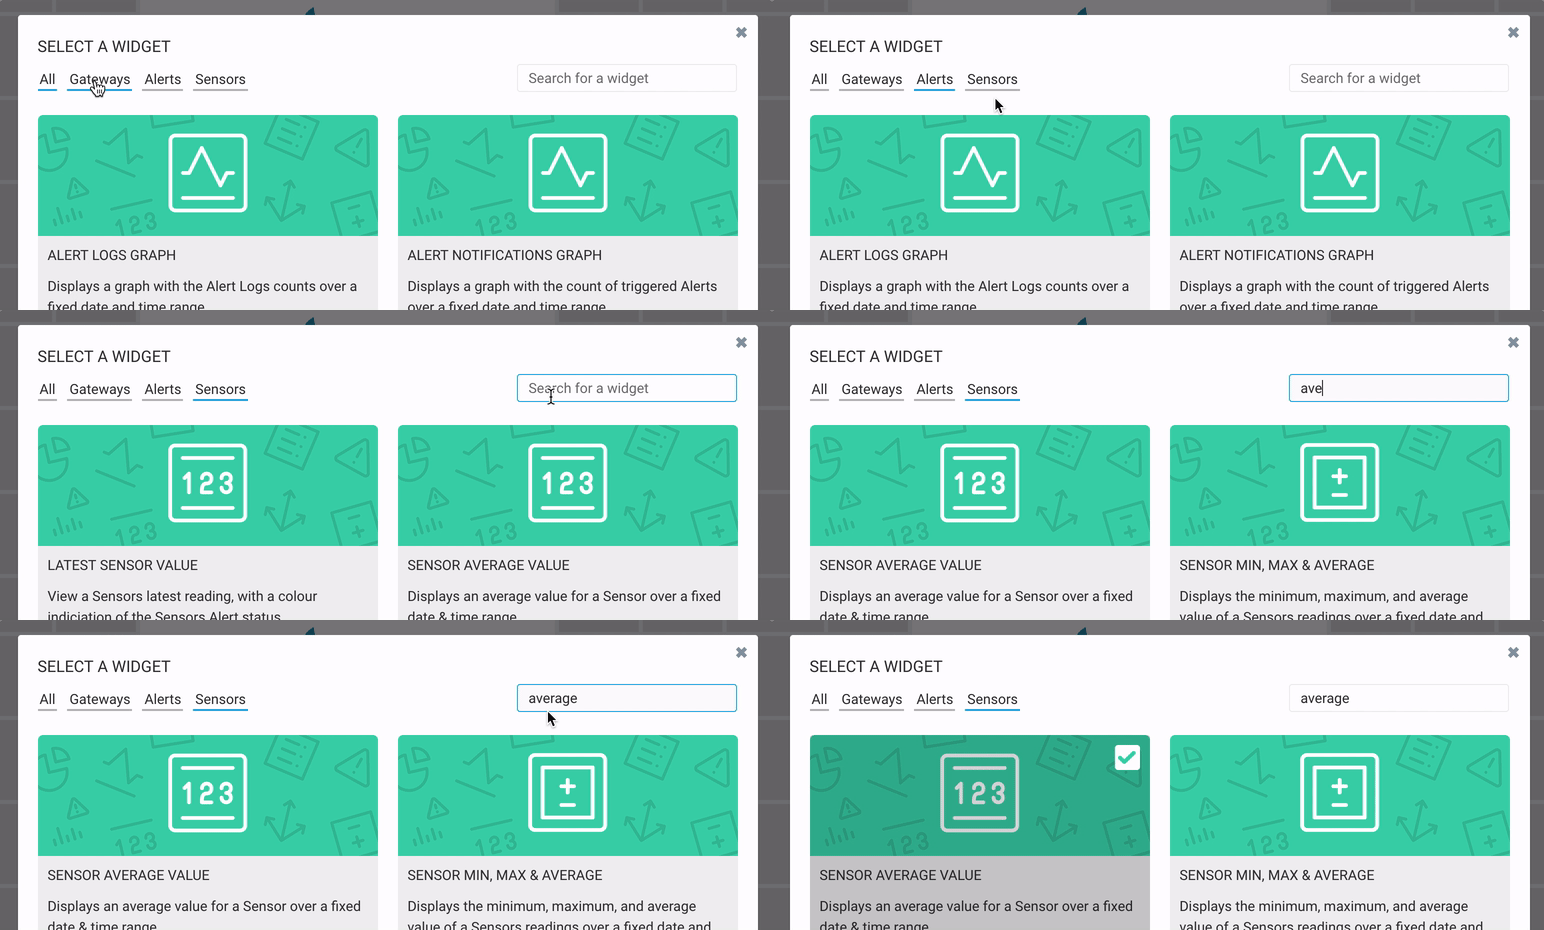
We shipped an update to widget selection when adding a widget to a Custom Dashboard in the Hark Platform to help users find the widget they’re looking for, sooner. Users can now filter available widgets by type or search for the widget by name, instead of scrolling through the list.

We’ve also now included more information when selecting a Sensor for a widget that allows you see when the Sensor last received data and where the Sensor is located within your Organization.
Analytics
Exporters Name on an Exported Document
Previously when exporting data from the Hark Platform, the user who exported the data was not present on the export itself. Now, when exporting Sensor Data, Averaged Sensor Data, Audit Logs, Alert Logs and User Activity Logs the name of the user who exported the data will be present in side of the export.
Bugs Fixed
- Fixed a bug where an Alerts “Value on Alert“ field was occasionally empty.
- Fixed a bug where an Alerts graph did not show the point in which an alert was triggered.
- Fixed a bug where an Alerts timeline was not showing the correct times.
Monitoring
Bugs Fixed
- Fixed a bug where the Audit Log table would not update in-browser and required a refresh to view changes when adding or removing a Sensor Relay from a Hub.
- Fixed a bug where an Alerts “Value on Alert“ field was occasionally empty.
- Fixed a bug where an Alerts graph did not show the point in which an alert was triggered.
- Fixed a bug where an Alerts timeline was not showing the correct times.