November 2019
In November we’ve delivered a major feature which provides 1st class support for meter-based Sensors in the Hark Platform.
Analytics
Metering Support has been enabled in the Analytics module this month.
Metering Support
With the months release of metering support in the Hark Platform, you can now easily see and understand the consumption profile of your meters. Meters, such as energy or water meters, report their data in an increment number and graphing out this data produces an unhelpful line that simply rises.
This always rising line makes it hard to understand your consumption profile during certain times of the day and results in manual calculations to see how much consumption you’ve used in the past hour, day, week or month.
Enabling metering support against a Sensor in the Hark Platform will break down the incrementing values and remove the headaches of manual calculations, so that you can see the consumption profile quickly and in your preferred chart type!
Enabling Metering on your Sensor
To enable metering on your Sensor, navigate to the Sensor in the Analytics module and click the “Sensor Settings” link in the command bar. From there, click the middle tab for Sensor Type Settings.
Here you can choose to enable metering and provide a reset value. Saving your changes will start providing metered data for the enabled sensor!
New Energy Widgets
As part of the new metering support, we’ve released three new Energy-focussed widgets. These widgets can be placed on a Dashboard to provide further insight into your energy meters!
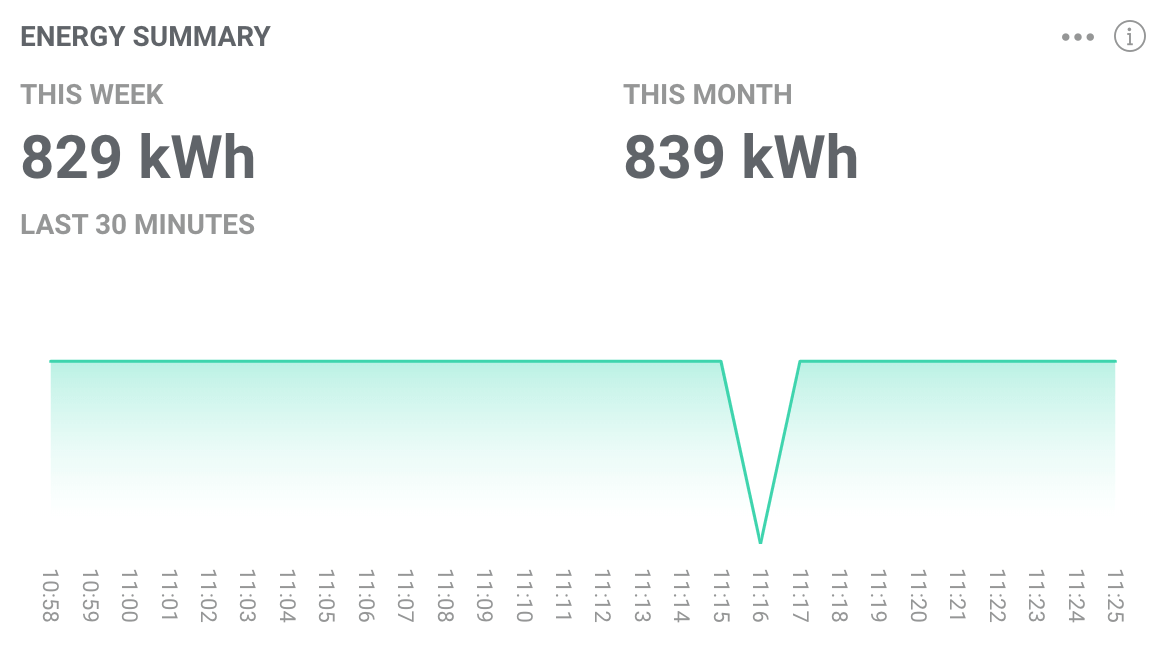
Energy Summary
The new Energy Summary widget gives you a quick overview of your recent consumption, across multiple energy meters, by showing you:
- The total consumption for the current week
- The total consumption for the current month
- The profile of your energy over the last 30 minutes
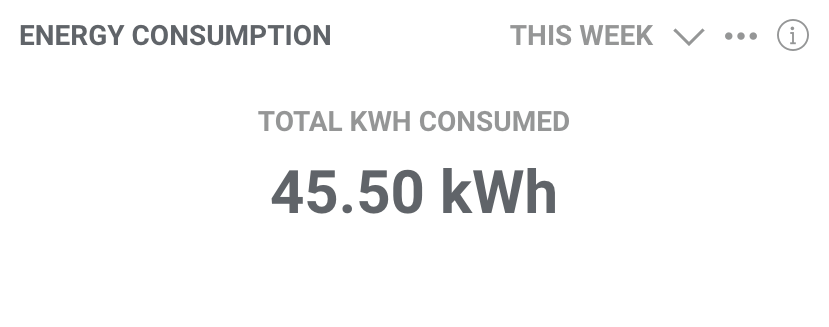
Total Energy Consumption
The new Total Energy Consumption widget provides you with a quick overview of your consumption for the last 30 minutes, day, week or month across multiple energy meter sensors. This is great for those times when you need to know the total energy consumption quickly!
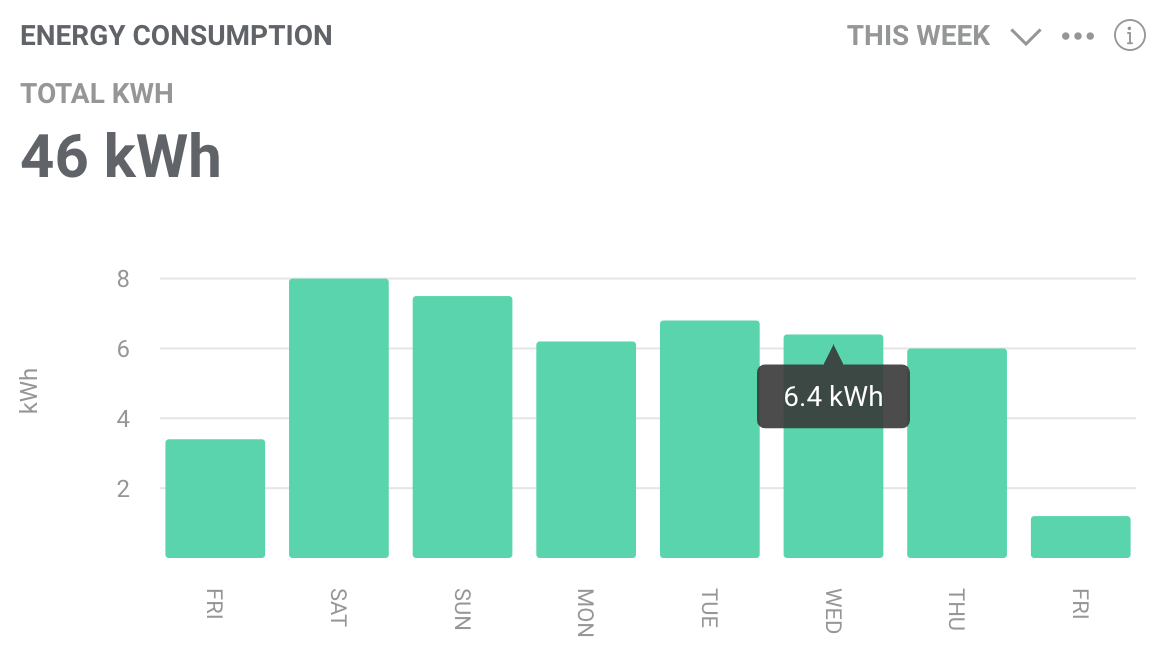
Energy Consumption Summary Over Time
The new Energy Consumption Summary Over Time widget shows you the total consumption of your energy over a selected time period, whilst also showing you your energy profile. If you want a quick total consumption number but may want to see when your energy peaked or dropped, this widget is for you!
Bugs Fixes
- An issue where the ticks of a graph would occasionally have duplicate entries for the last item of the X axis has been fixed.