July 2022
In July we've made a lot of major enhancements in the Hark Platform across Analytics, Twin Engine and our Cloud Broker. We've also made some fantastic quality of life changes to improve day to day use of the Hark Platform.
Adapters
In June we announced our brand new connectivity capabilities with Adapters. Adapters are are deploy-to-the-edge containers that talk directly to the devices and assets that you need to connect to, and we have a range of them to support all the devices, and protocols, you need. Some of the most common protocols we deploy with our Adapters are BACnet, Modbus (Modbus RTU and Modbus TCP), OPC-UA, OPC-DA, SNMP and ODBC.
Adapter Discovery
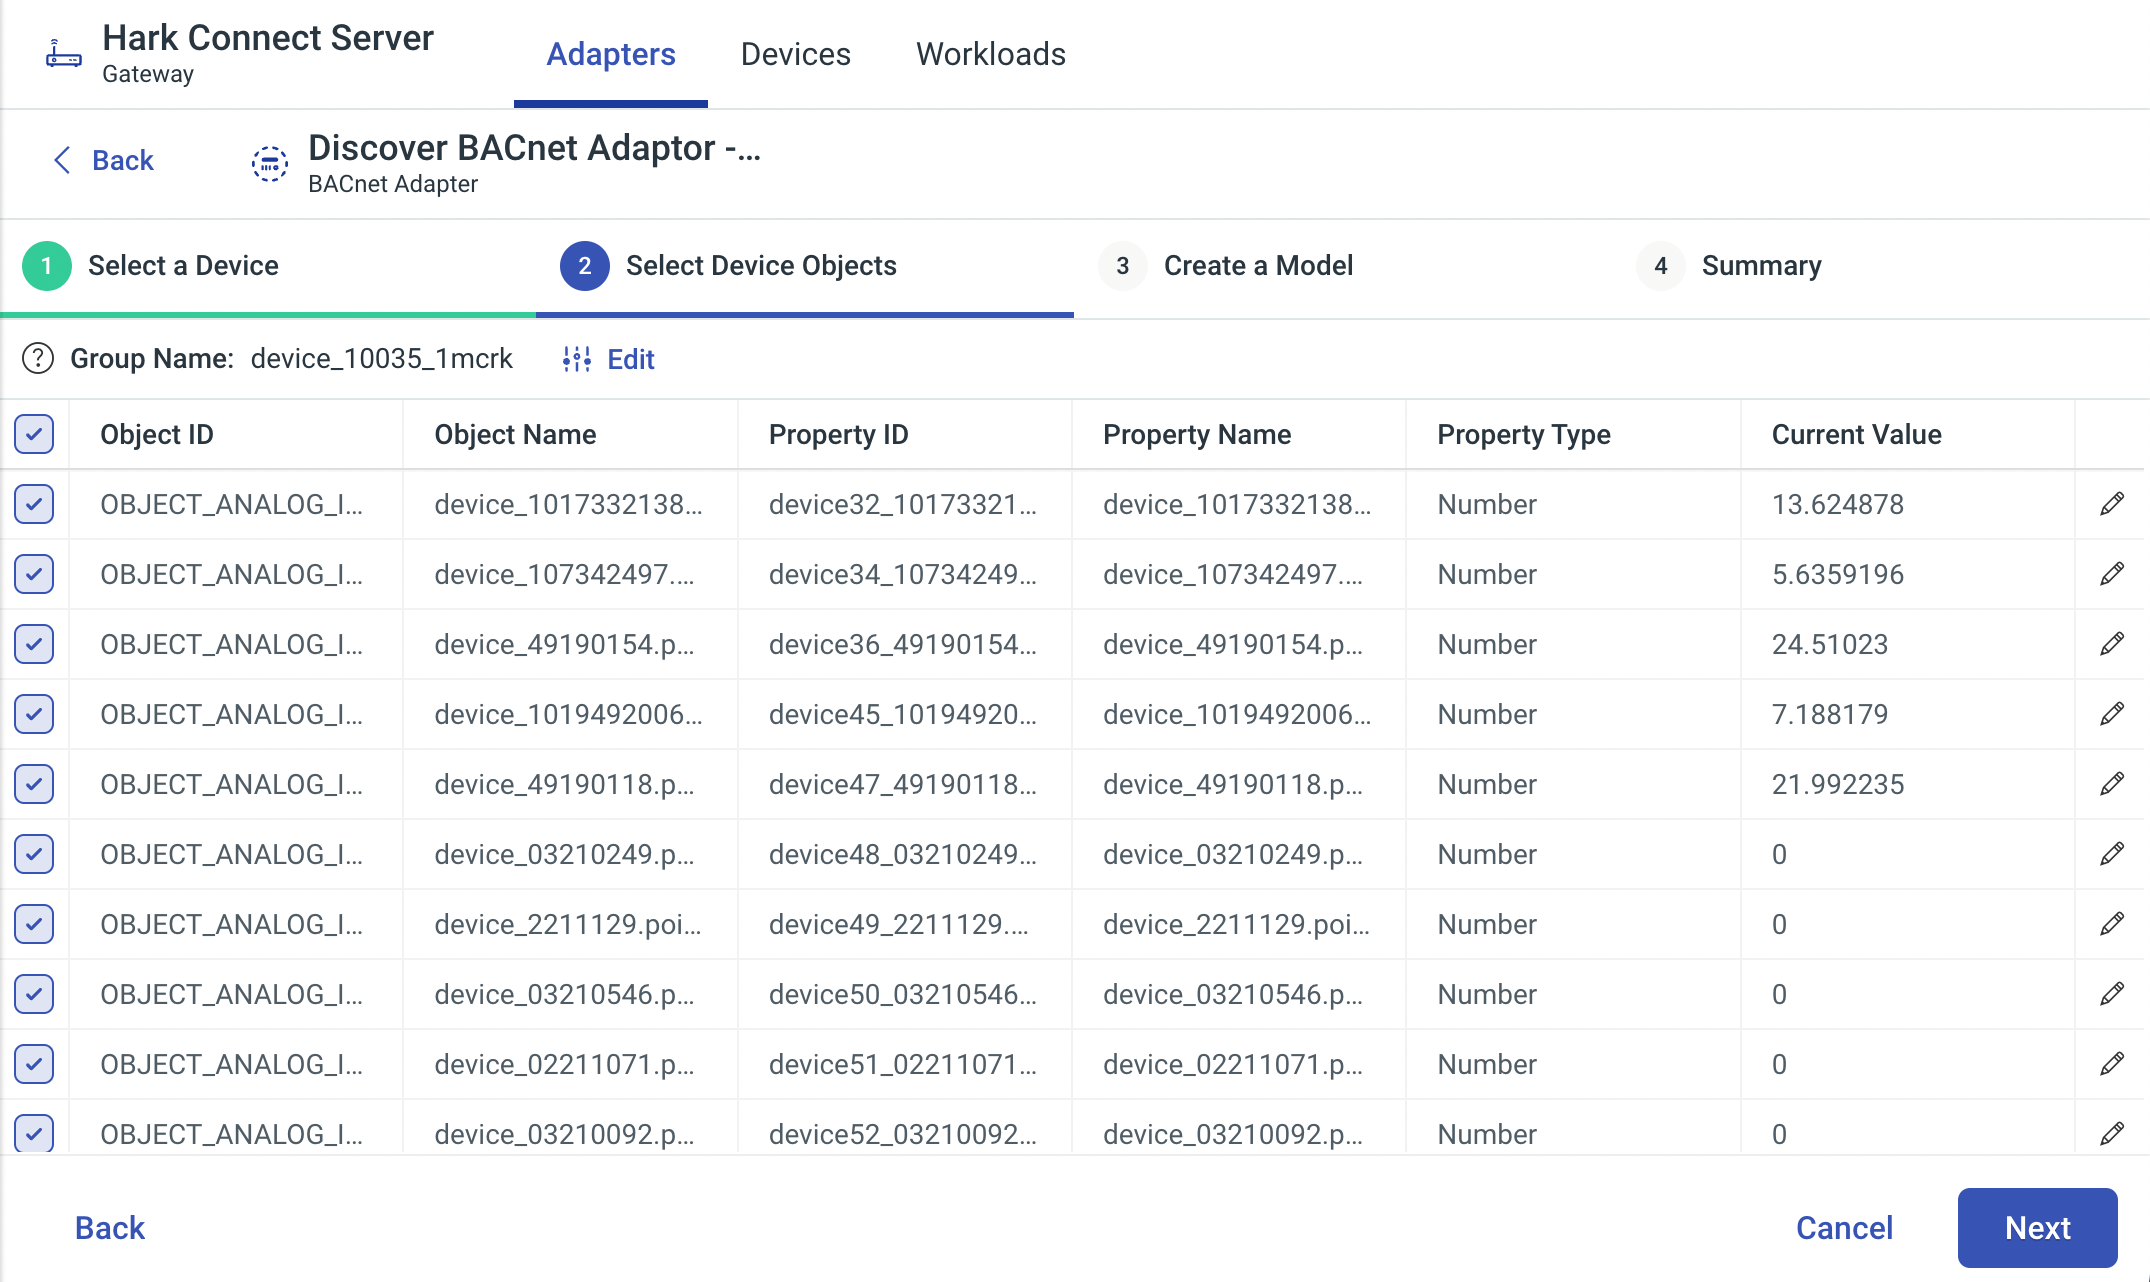
Today we're excited to release our brand new Adapter Discovery feature that helps our customers go from zero to full-IoT deployment in a matter of minutes. Our intuitive interface guides you through a easy process of selecting what data you want to stream from a device or asset and does all the hard work for you.
Once you've gone through the simple discovery process, your devices and assets will be streaming data to the Hark Platform in real-time, ready for you to focus on the real value in IoT.
Updates to Creating an Adapter
When creating an Adapter, the Hark Platform will now auto-suggest a topic prefix for your Adapters configuration to speed up the process of creating an Adapter in the Hark Platform. If you have a preference or want to configure your own Topic Prefix, you'll still be able to manually set a topic prefix.
Adapter Deployment Configuration
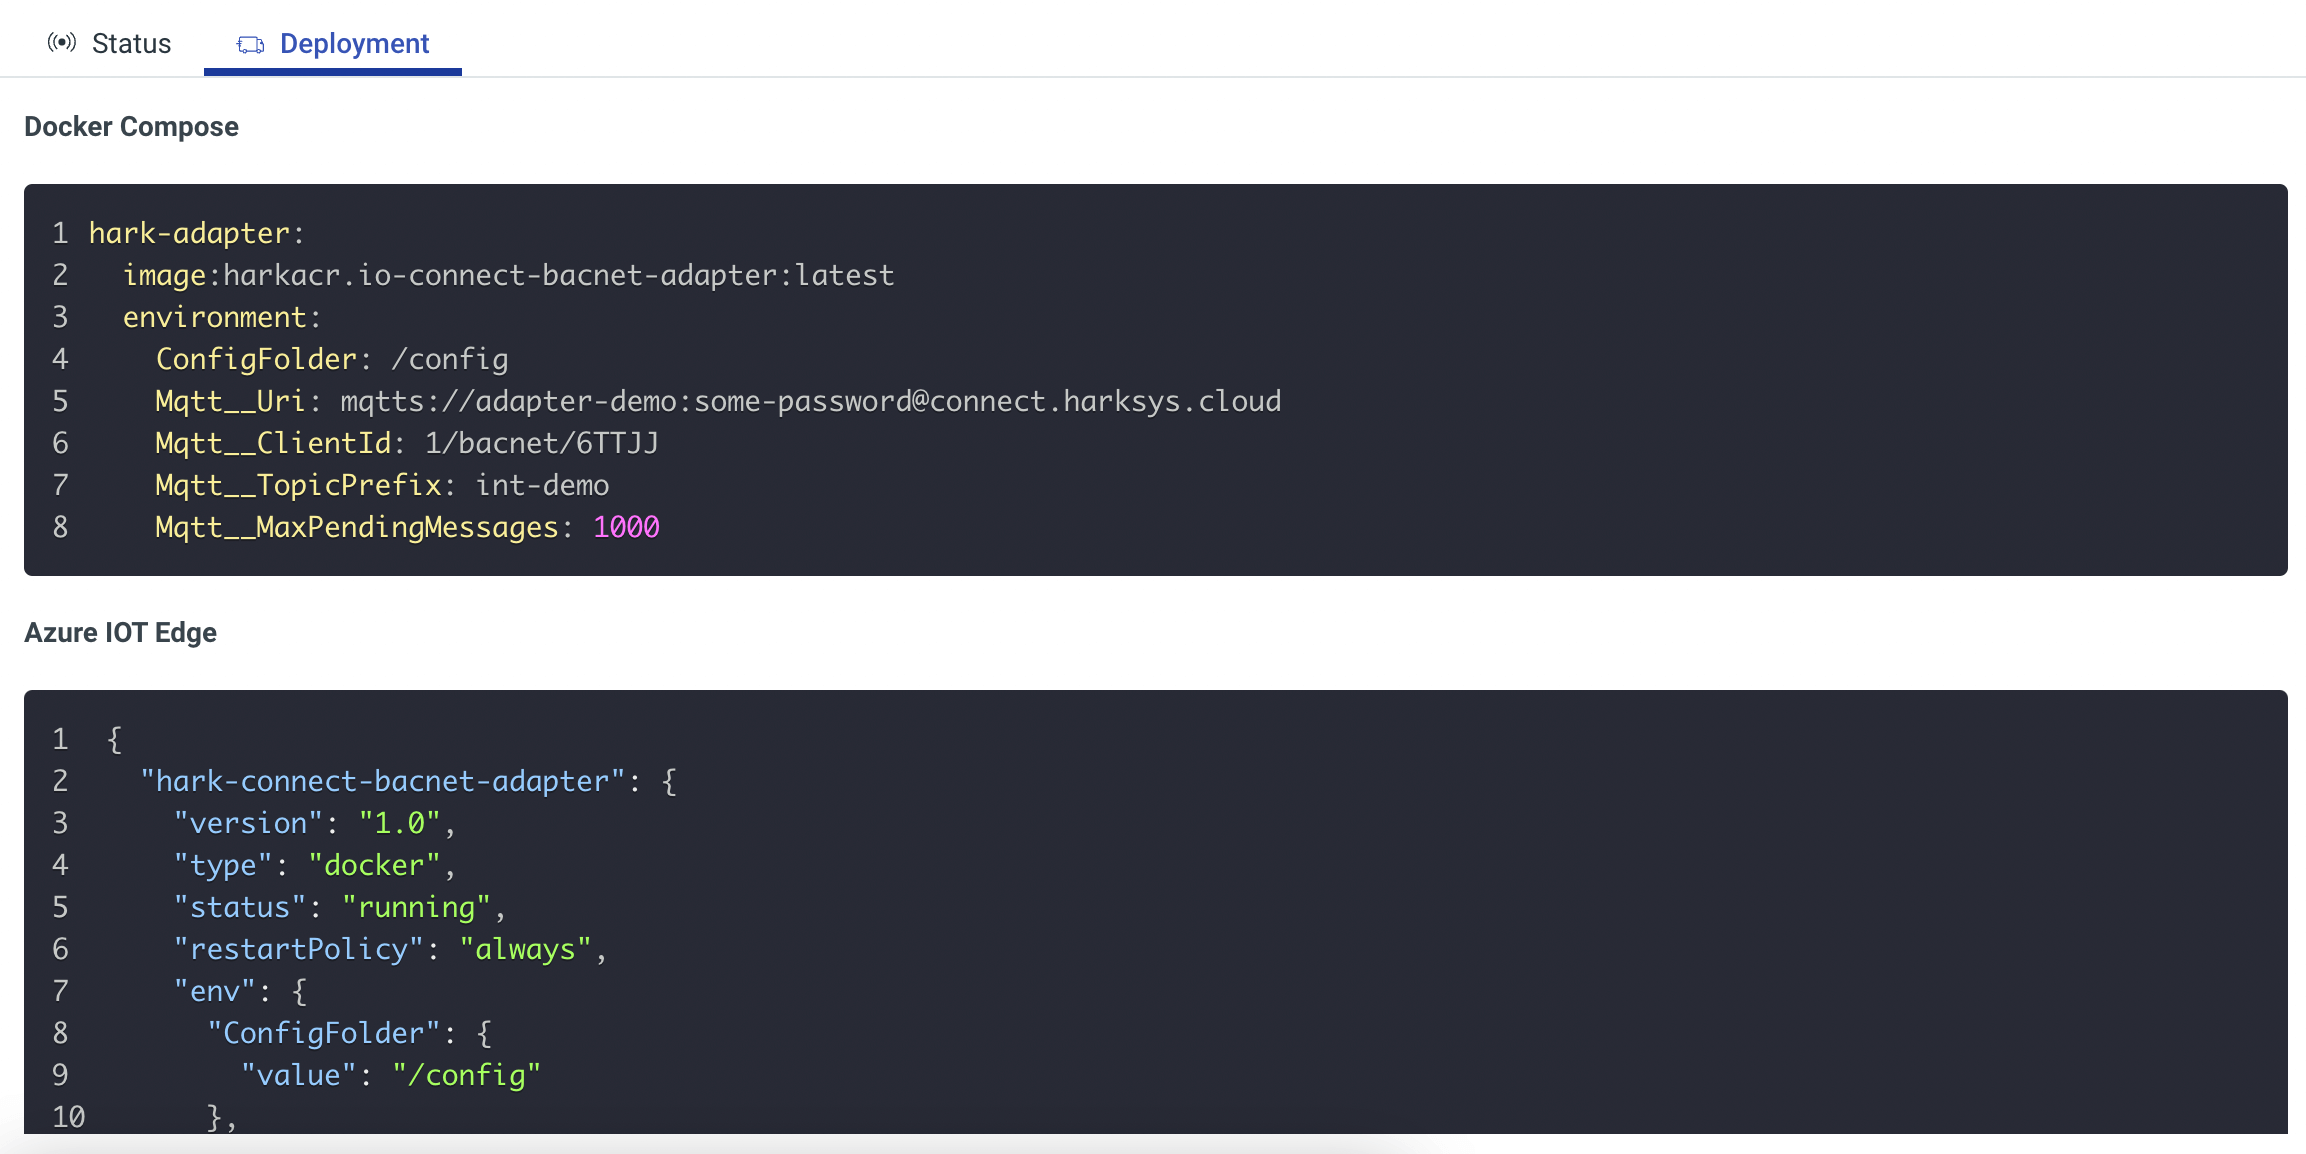
Once you've created an Adapter in the Hark Platform, you need to deploy it to your edge devices. To help our users speed up the process of deploying Adapters to the edge, we've included a pre-generated configuration to deploy your Adapter in a Docker Compose file or IoT Edge, prepared with all the configuration and credentials your Adapter needs to get up and running quickly! Simply copy the configuration in to your deployment, deploy and your Adapter will be running and ready to stream data from your assets, to the Hark Platform.
Adapter Status Information
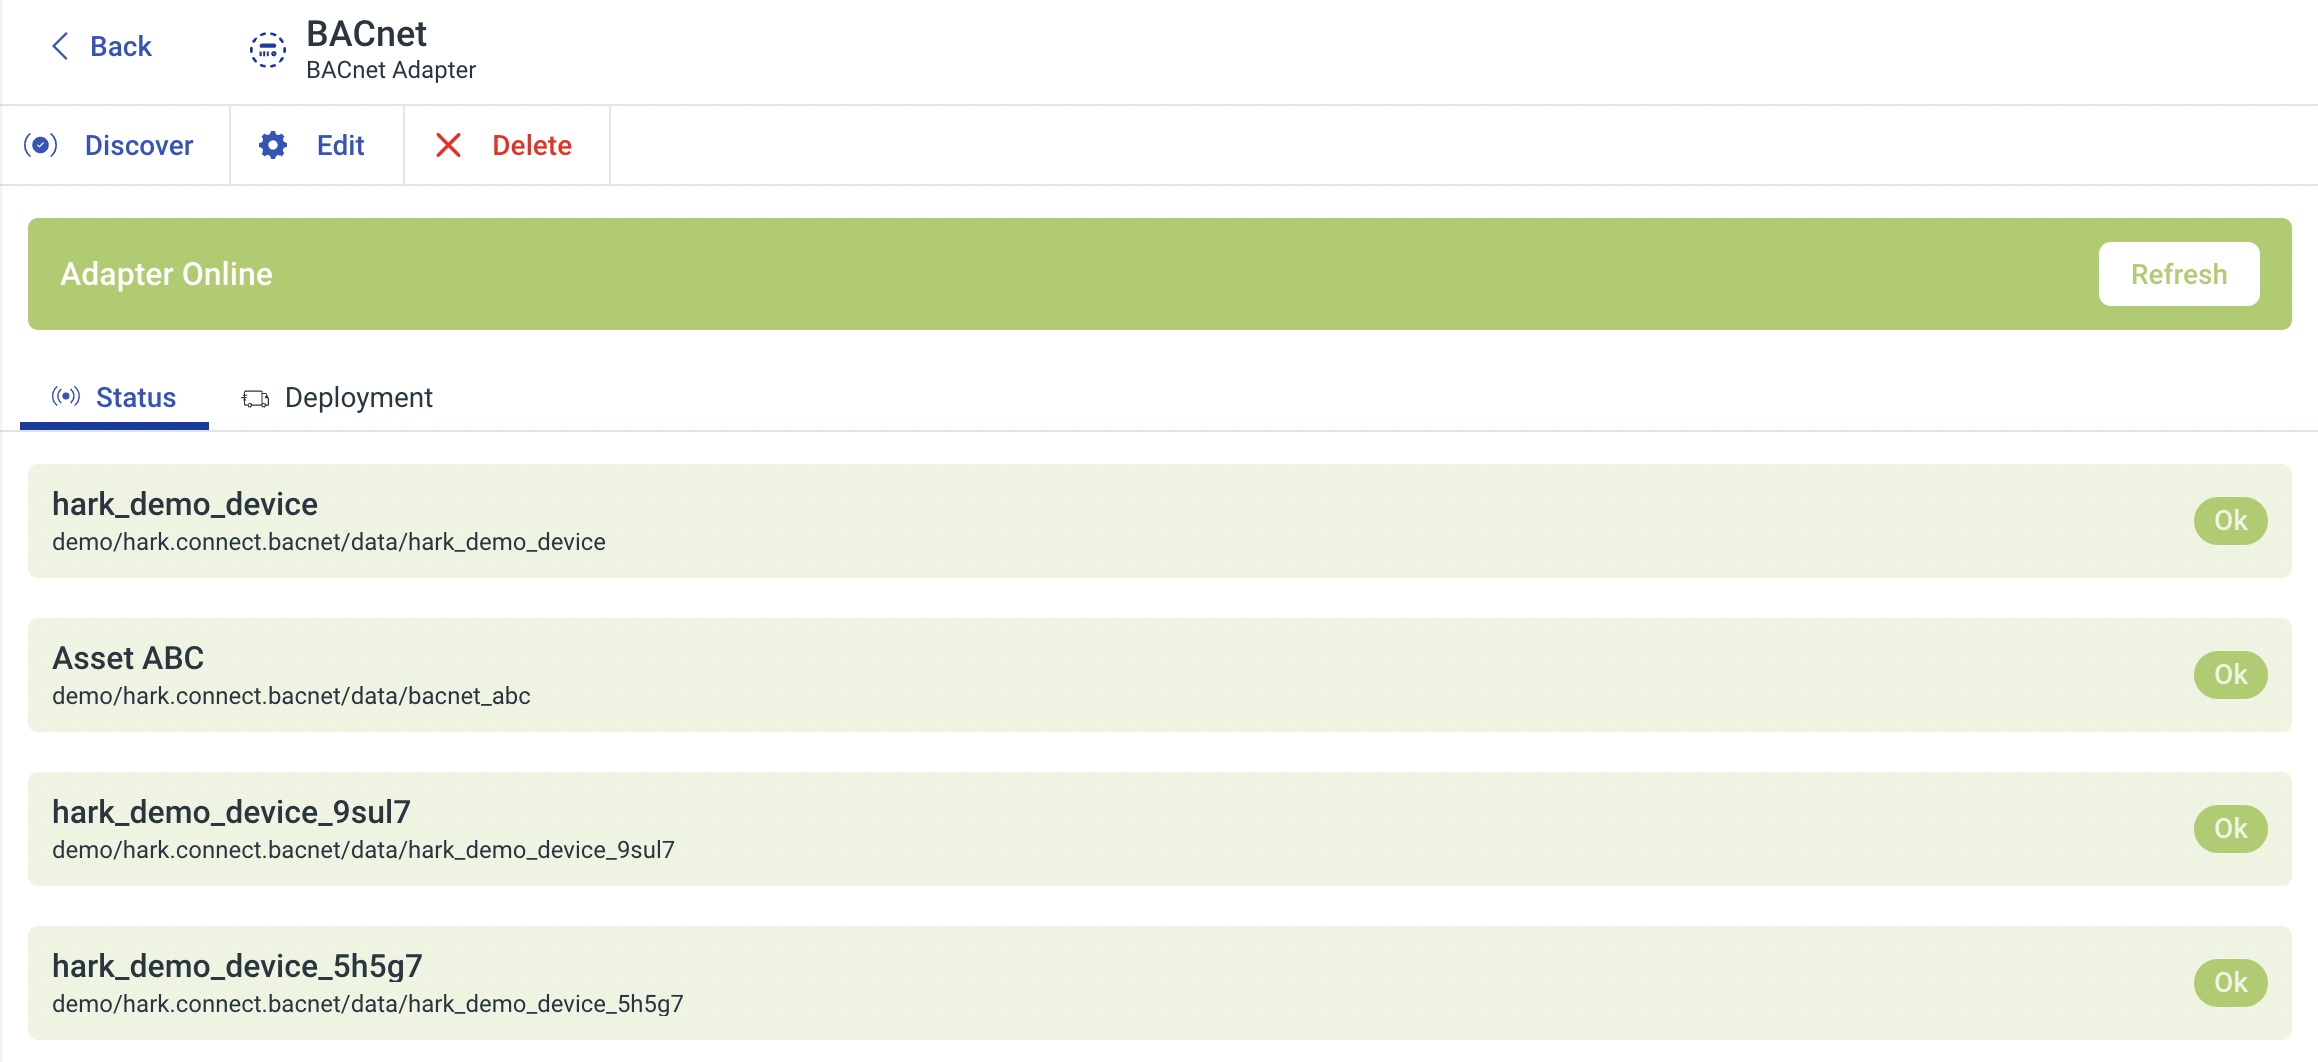
With an Adapter deployed, configured and pulling data from your assets, it helps to know how your Adapter is performing, are there any issues or are we up and running smoothly? Now when viewing your Adapters in the Hark Platform, you'll see status information for each configured asset to get you answers at a glance. Each configured asset your Adapter is streaming data from, if one of your assets is offline, you'll be able to see which one.
And yet with all of the above, we've still got more to come so stay tuned!
Analytics
Nested Groups Support
Now within the Analytics module, you can create the hierarchy that makes sense for your Organization with the ability to create Groups under Groups, with no limits!
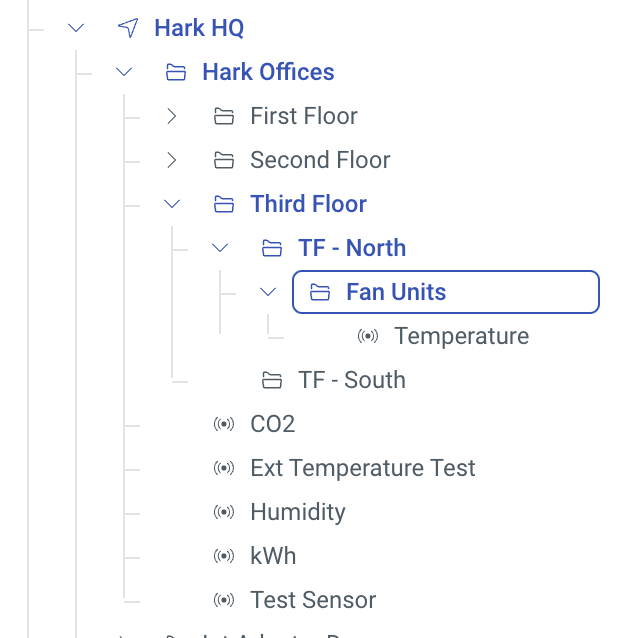
No matter what structure makes sense for your Organization, you can recreate it in the Hark Platform!
Moving Sensors & Groups
With the addition of our new organisational features in the Analytics module, we've added some extra functionality to help you get your Organization in to the structure you want.
Now, when editing a Sensor or Sensor Group you can select a new Group. Save your changes and you'll see them immediately reflected in the Hierarchy!
Twin Engine
Property Names & Changed Timestamp
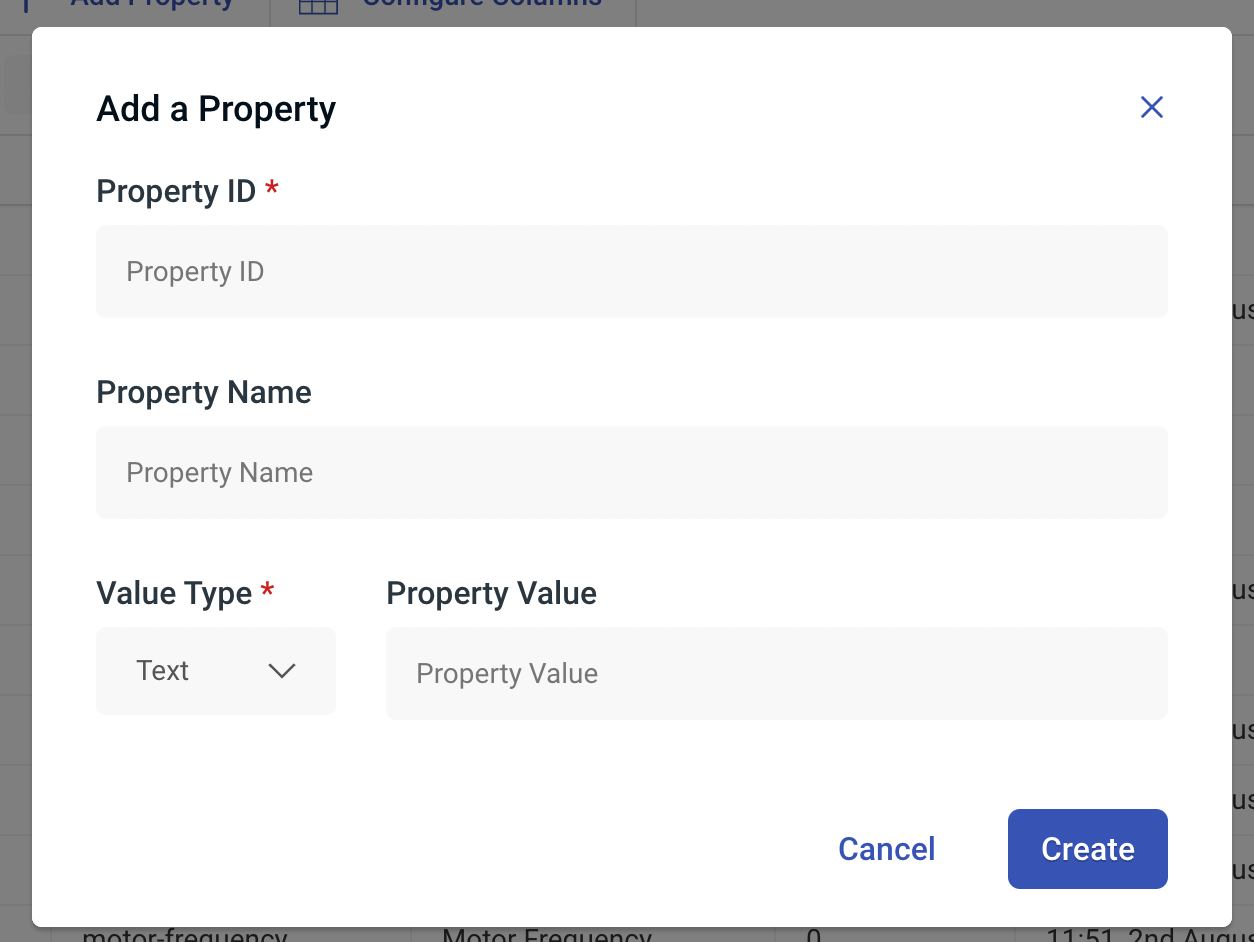
Model Properties are the key to modelling your assets in the Hark Platform. They provide real-time data from your assets out in the field, available at a glance! Property IDs are used to address a Property throughout the Twin Engine, and previously how you would identify what a property was, until now.
When creating or editing a Property, you can now supply a human readable name to help you make more sense of your Assets data. For example, a fan unit may expose a property of MD_r - what is that supposed to mean?! Now, you can set the Property Name to Operation Mode, that feels much better!
With the addition of Property Names, we've also integrated them with our new Adapter Discovery features, for quicker access to recognisable telemetry from your assets, as well as the Model Template and Model Properties widget.
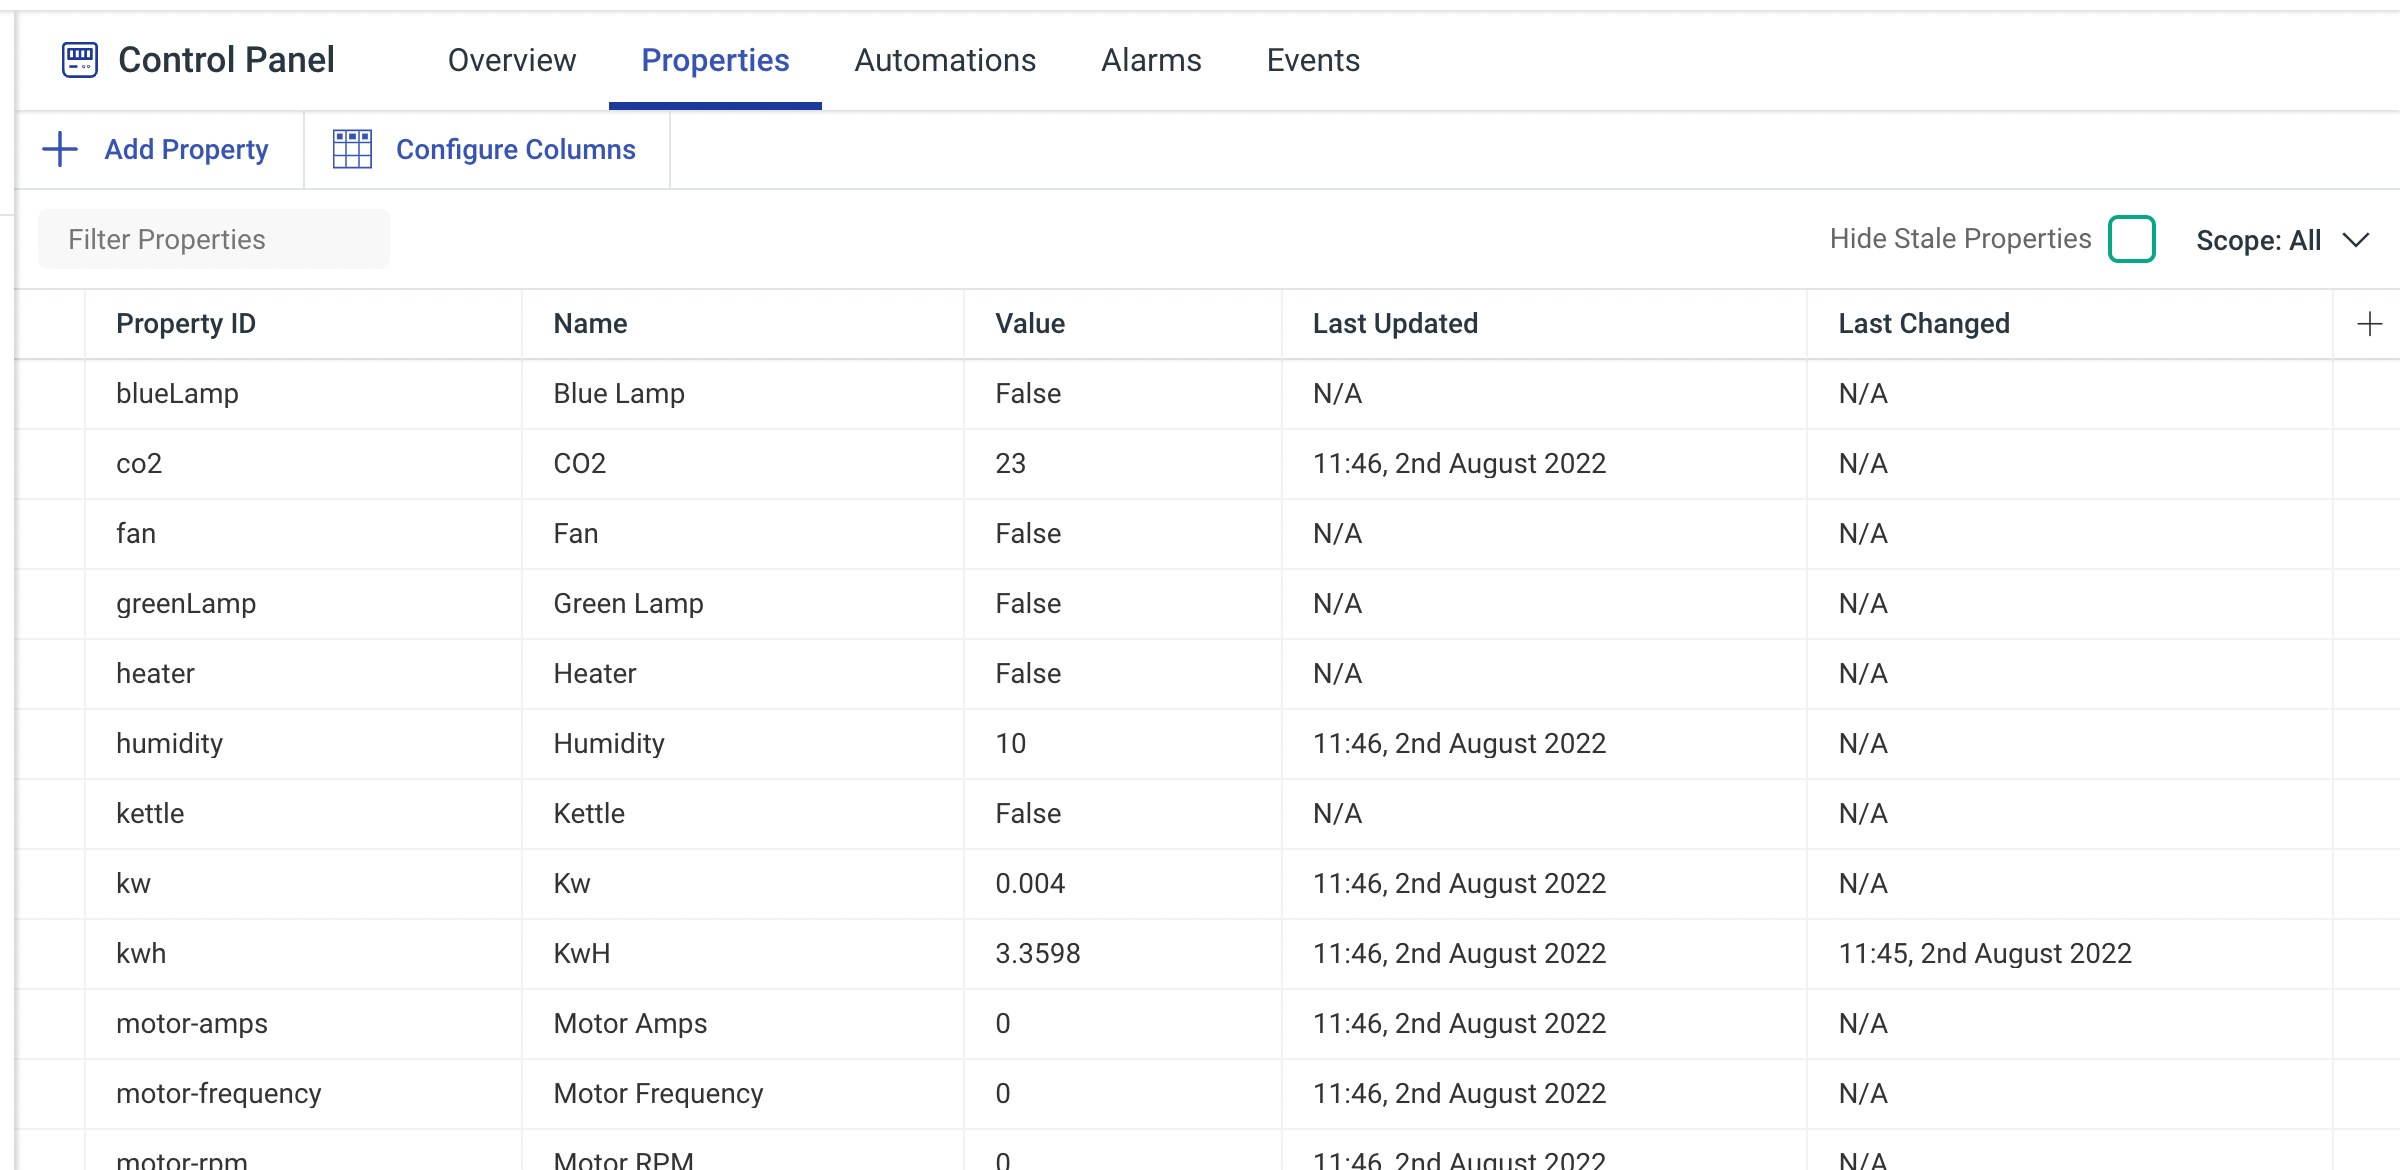
We've also added a brand new Changed Timestamp column to the Properties table under a Model alongside the Updated Timestamp column. The Updated Timestamp column helps you understand when a property last received data from an Asset. With the new Changed Timestamp, you can see at a glance when a property last changed from it's previous value.
Configurable Columns
To go along with the additions to Model Properties, you can now configure which columns you see when viewing Properties for a Model. Click Configure Columns in the action bar and select the columns that are most important to you. The table of properties will instantly reflected your configuration.
Automations
User Defined Functions
User Defined Functions (UDFs) are an extremely powerful way to extend the ability of the Hark Platform by allowing your to write JavaScript to transform data, perform actions and pull data from the Hark Platform in to whatever it is you're putting together.
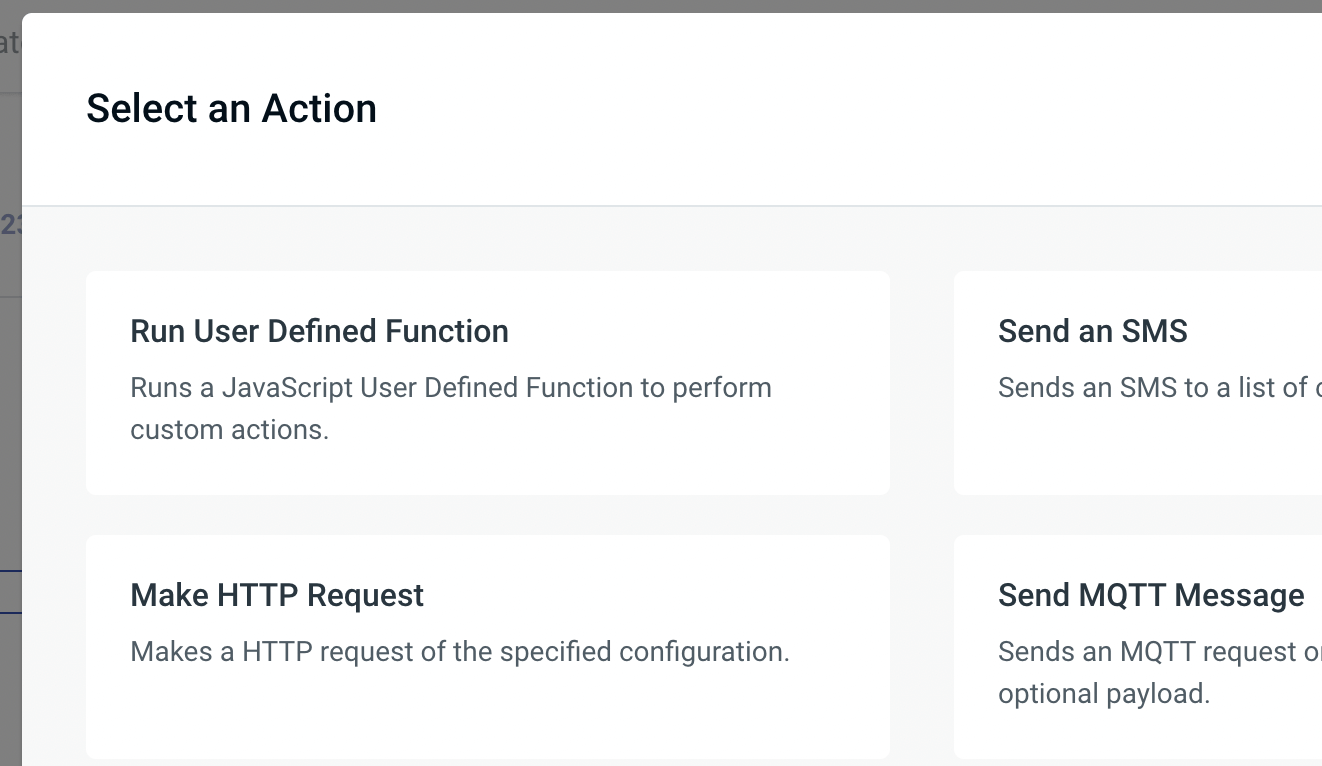
We've added JavaScript UDF support in Automations with a Trigger and Condition, to help you decide when your Automation should run, as well as an Action, which allows you to perform custom actions whenever your Automation has been triggered.
When writing a UDF you have access to a wide range of functions that allows you to get data for your Models, Alarms, Events and more - you can even execute another Automation!
What does all of this mean in the real world? To give you a real-world example you can have an Automation that triggers when a new Alarm is activated. Using a User Defined Function Action, you can get all of the telemetry for an Asset, and send it straight over to a work order system to help the engineer on the other side with all that they need to know in order to fix the problem sooner!
We're also releasing documentation to help you make the most of using UDFs in the Hark Platform, read our Introduction to UDFs guide for more information.
Condition Groups
Now in Automations, you can select a Condition Group Condition to group up a set of Conditions and apply an operator on the group to help you build more complex Automations. The operators available are And, Or and Not.
For example, if you want your Automation to trigger when at least one of your Conditions pass, you can group them in a Condition Group with the Or Operator!
Alarm Condition

If you want to ensure that an Automation only runs when you have an Alarm that matches a severity, status or set of parameters, you now can! We've added a new Alarm Condition to help you do just that.
Trigger Automation Action
You can now trigger other Automations run from within another Automation, just use our brand new Trigger Automation Action within the Automation Editor and select the Automation you want to run. Triggering another Automation can help you split your Automations in to reusable chunks for maintainability.
Automation Searching
Now when viewing a list of your Models Automations, or your Organization-level Automations, you'll be able to search through all of your Automations to help you find the Automation you're looking for, nice and quickly!
Time-Zone Field Updates
We've updated the Time-Zone select fields, in areas such as the Time of Day Condition and On Schedule Trigger, to include the ability to search the options quickly, to help you find the options you're looking for quickly!
Automation Editor Quality of Life
When creating or editing an Automation, now if you select the wrong Trigger, Condition or Action, you'll be able to click back to select the item that you were actually wanting!
Events Table Widget
We've added a brand new Events Table widget to the available collection of Widgets in our Dashboarding system. This new Widget, when configured, will provide you with a list of Events and their attributes that match the configuration you enter. This helps you see all of the actions and events for your assets in a glance.
Twin Engine - Quality of Life Improvements
- Alarms History Widget - If a row in the Alarms History Widget is an Alarm for a Model, you'll be able to click the row to go directly to the Alarms for the relevant Model.
- Model Alarms - The Alarms view under a Model will now show a years worth of Alarms by default, an increase from 7 days.
- Compact Views - To help our users focus on the important details, we've redesigned the Model Views, such as Properties, Automations, Alarms and Events, to a more compact view.
Cloud Broker
Our Hark MQTT Cloud Broker allows you to integrate with the Hark Platform without requiring your own deployment of an MQTT broker, simply point your devices to send data to the Hark Broker, and we'll take care of security and stability.
Cloud Broker User Interface
In July, we've released our brand new user interface for the Hark MQTT Cloud Broker. Our intuitive user interface lets you configure users and permissions, as well as see what the Cloud Broker is doing for your Organization to help in debugging and configuration.
Users
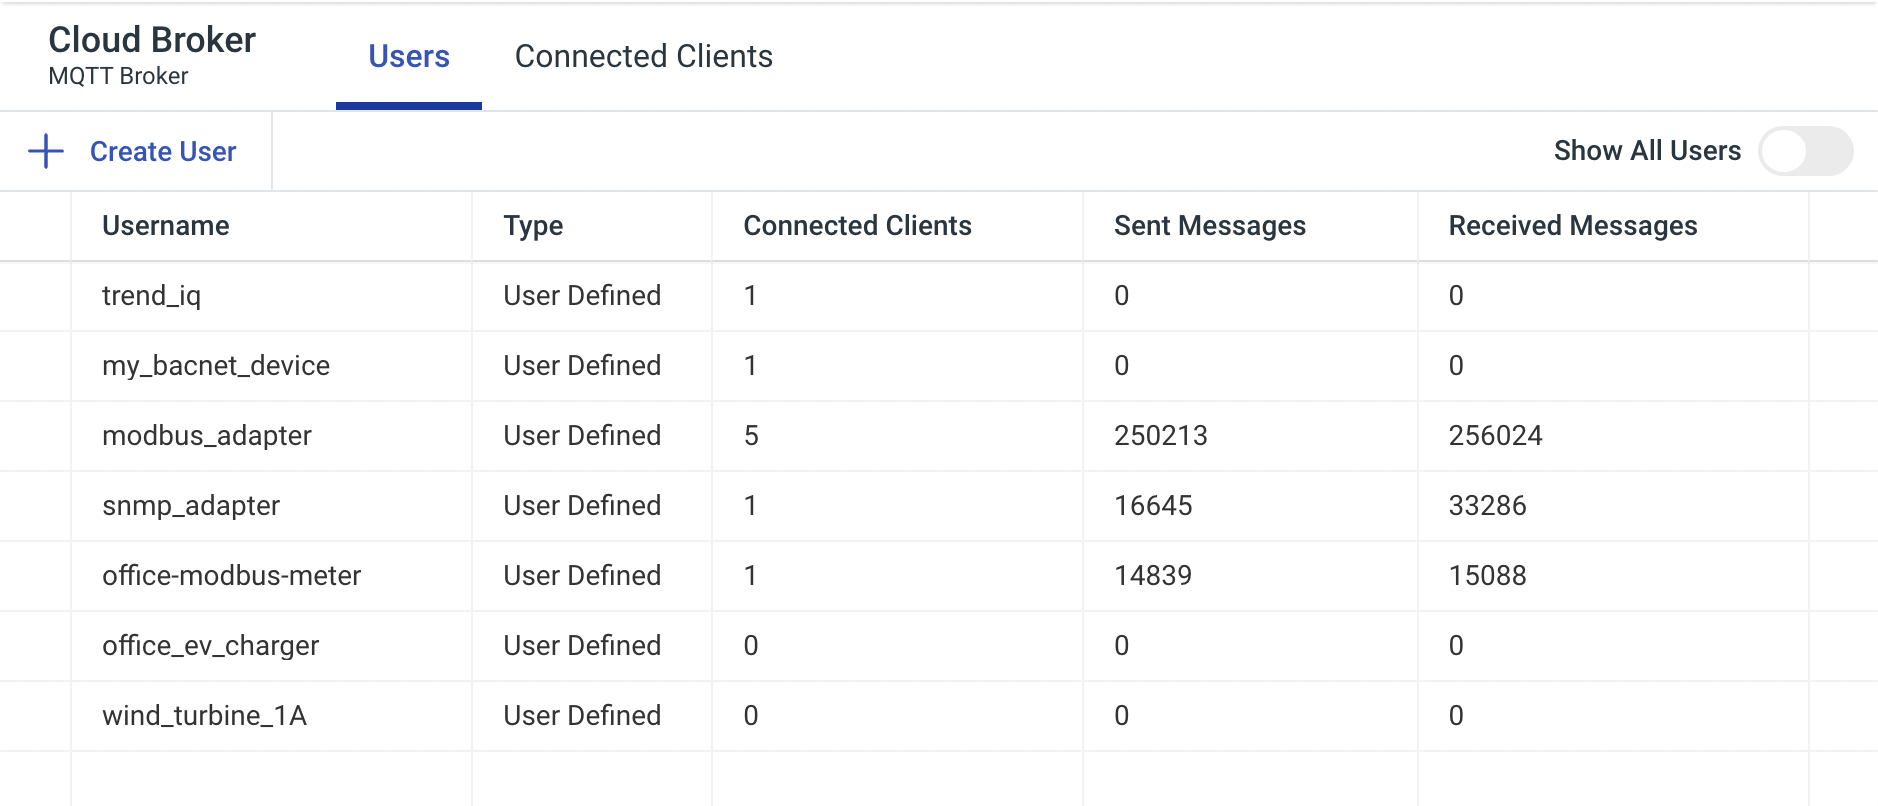
In our new Cloud Broker user interface, you can manage and see all the users configured that have access to your instance of the MQTT Cloud Broker, directly alongside how many clients are using a users credentials, how many messages that user has sent and how many have been received.
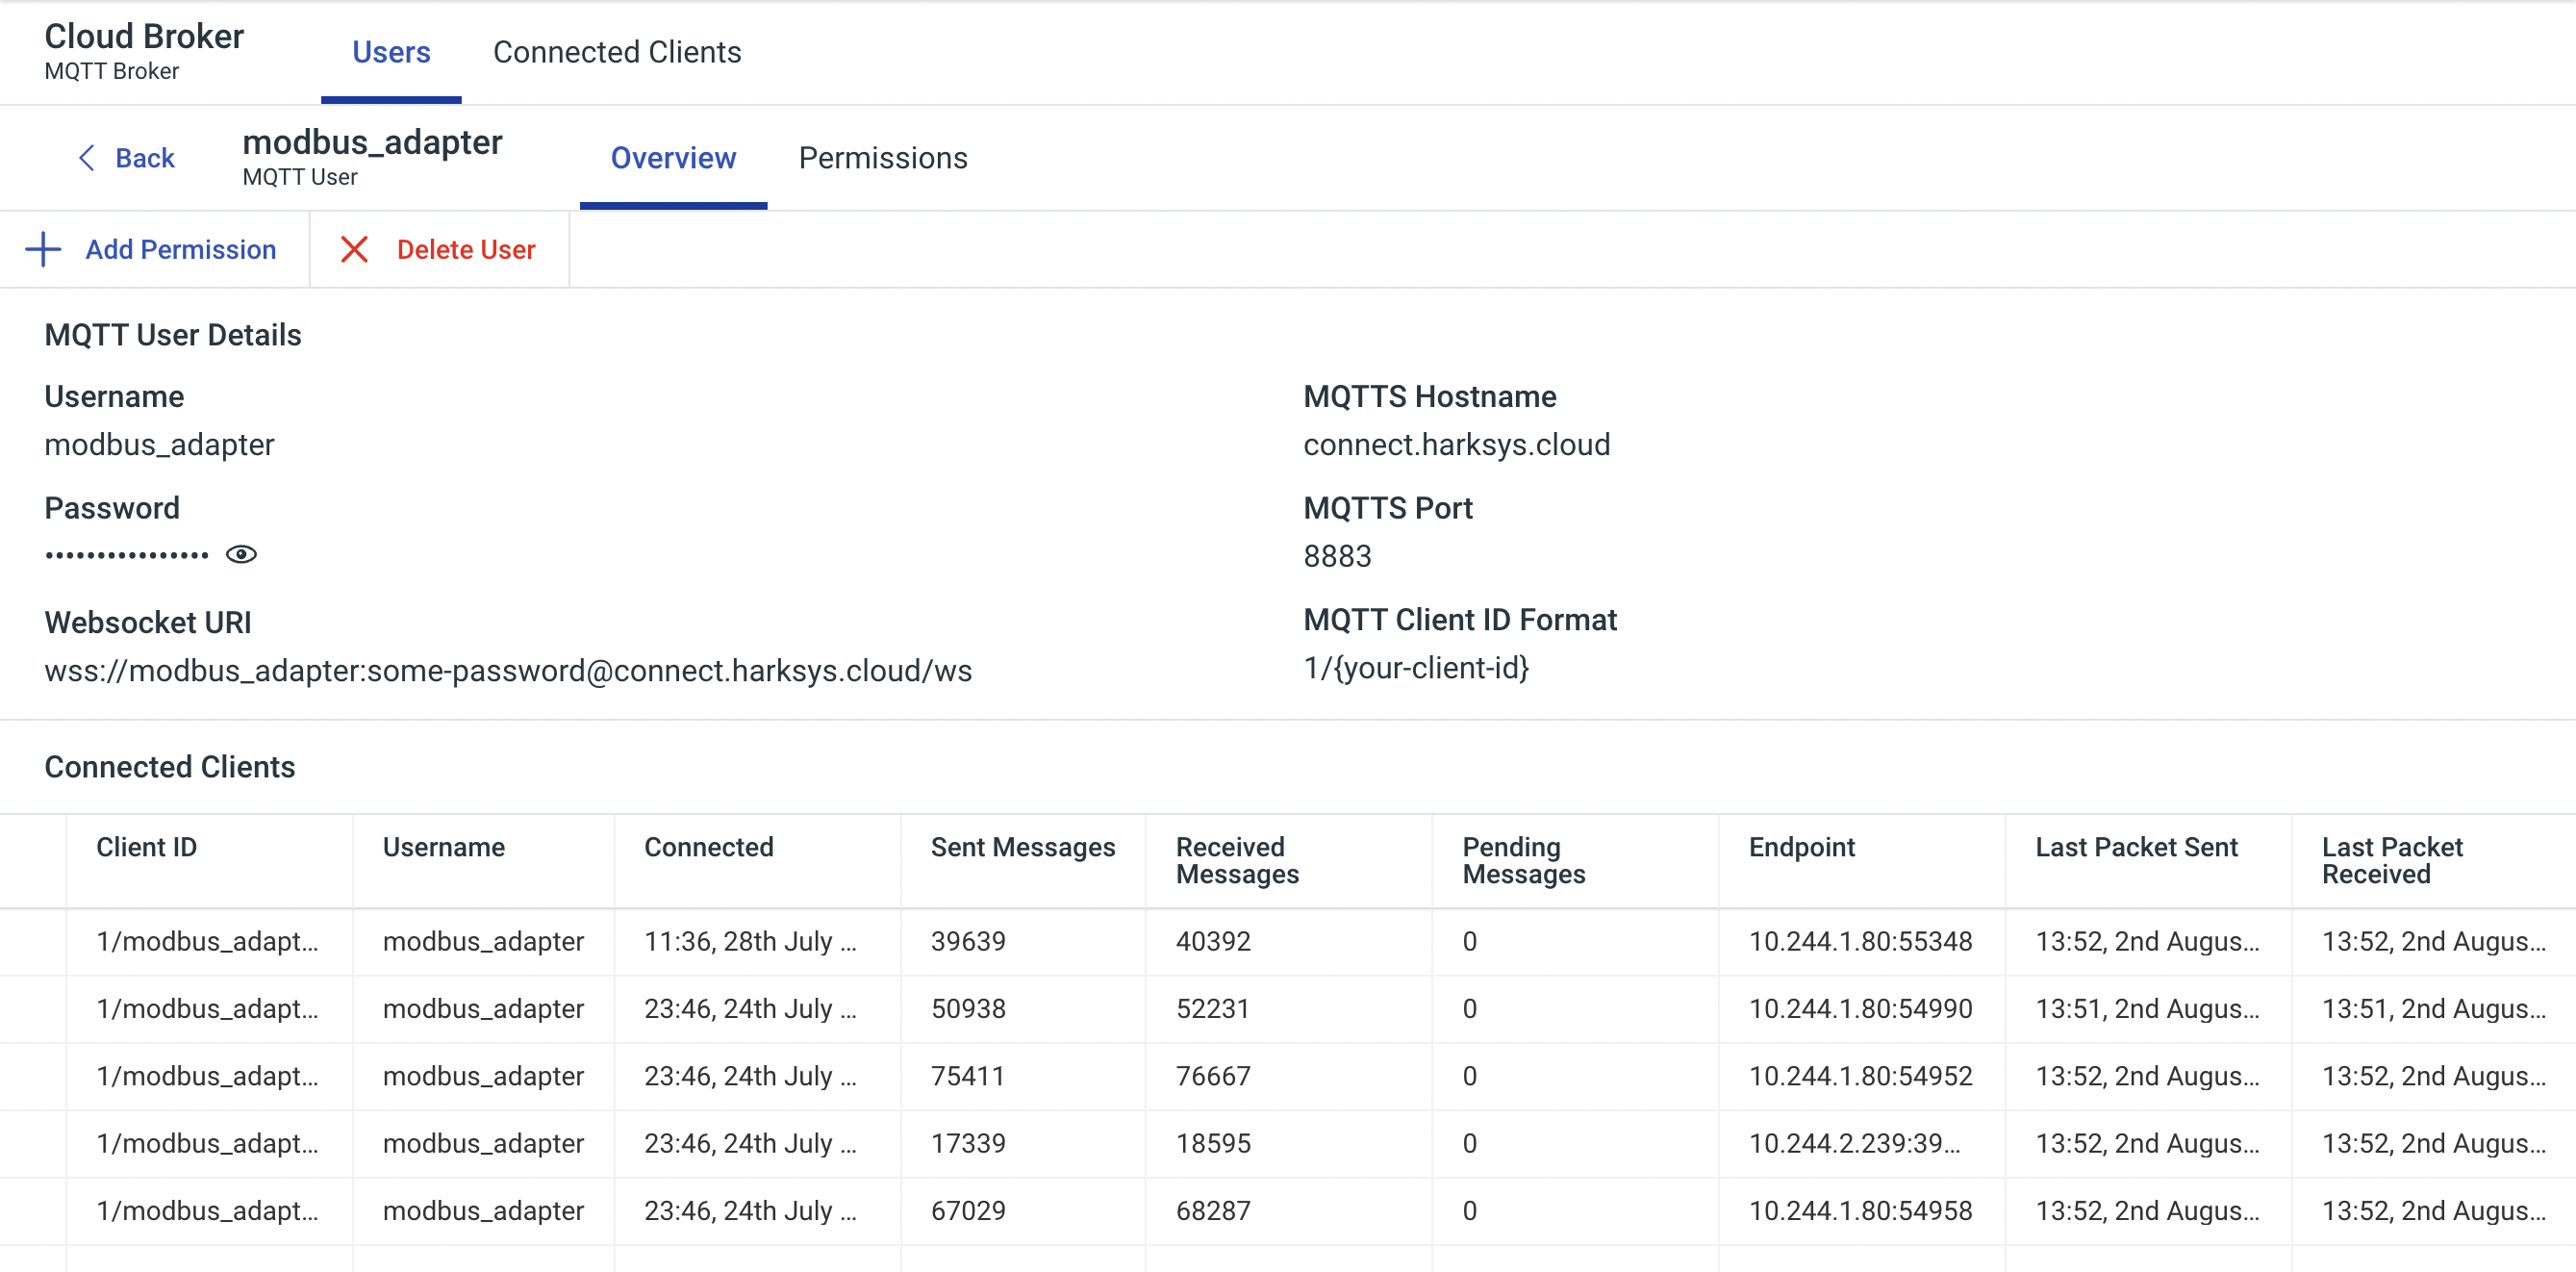
You're also able to add a new user, delete an existing user and view details for specific user by clicking on one of the configured users in the list. When viewing a user, you'll see a break down of that users configuration, which clients are using that users credentials and manage the security permissions for the user. The users password is always hidden by default, but can be shown by toggling the password-visibility button.
When adding a new user, you can generate a password in one-click to help get you going with the Cloud Broker quicker.
Connected Clients
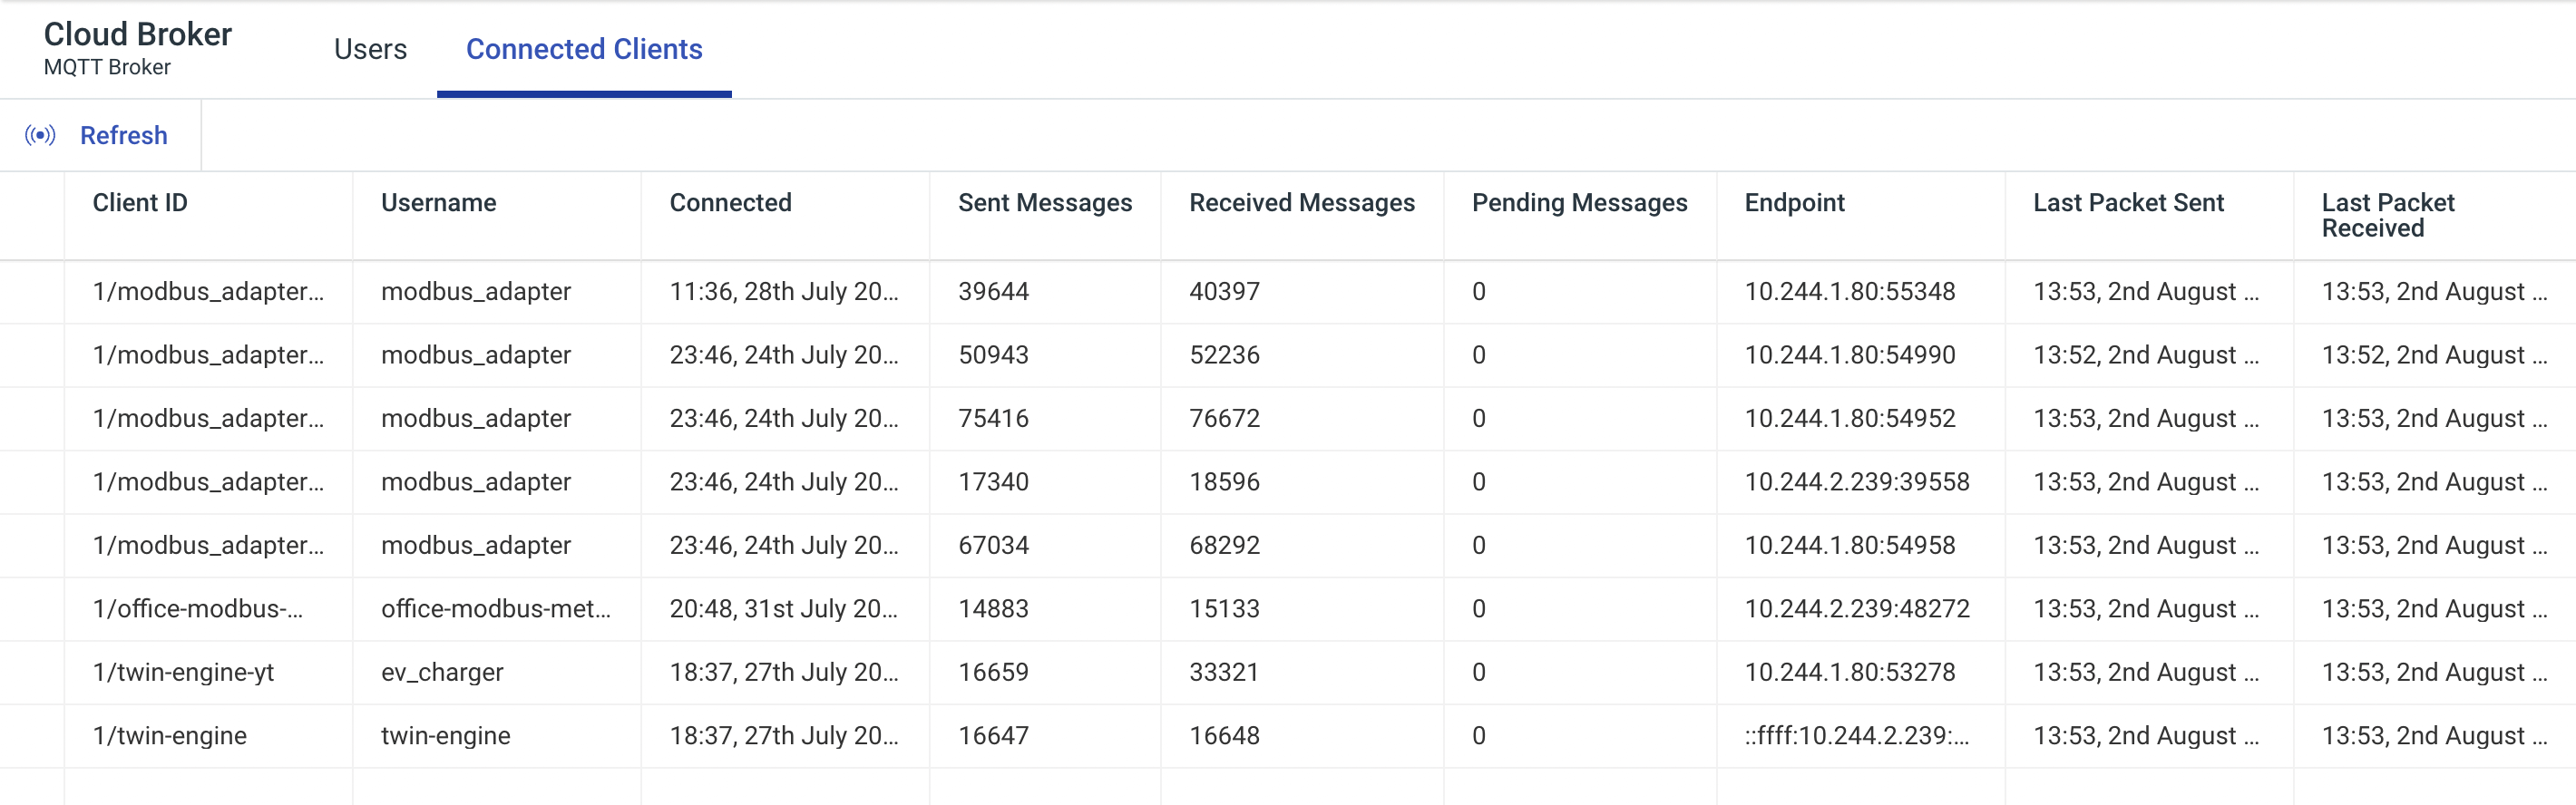
Under the Connected Clients tab, you'll see a list of all the clients connected to your Cloud Broker. Each client in the list has a full range of information such as Client ID, Username, when it last Connected and statistics such as Sent Messages, Received Messages, Last Packet Received, and more.