November 2022
In November we've released a brand new feature to our Automations in the Twin Engine that helps you to build, monitor and debug your Automations with powerful detailed logging outputs. We've also added some further monitoring information to our Adapter system.
Twin Engine
Automation Debugging
Automations are an extremely powerful feature of the Hark Platform, enabling a simple way to build complex alarm strategies, model your business processes, control devices and integrate with other services in a powerful yet intuitive user interface. In November we're pushing even further to improve the monitoring and debugging features for Automations.
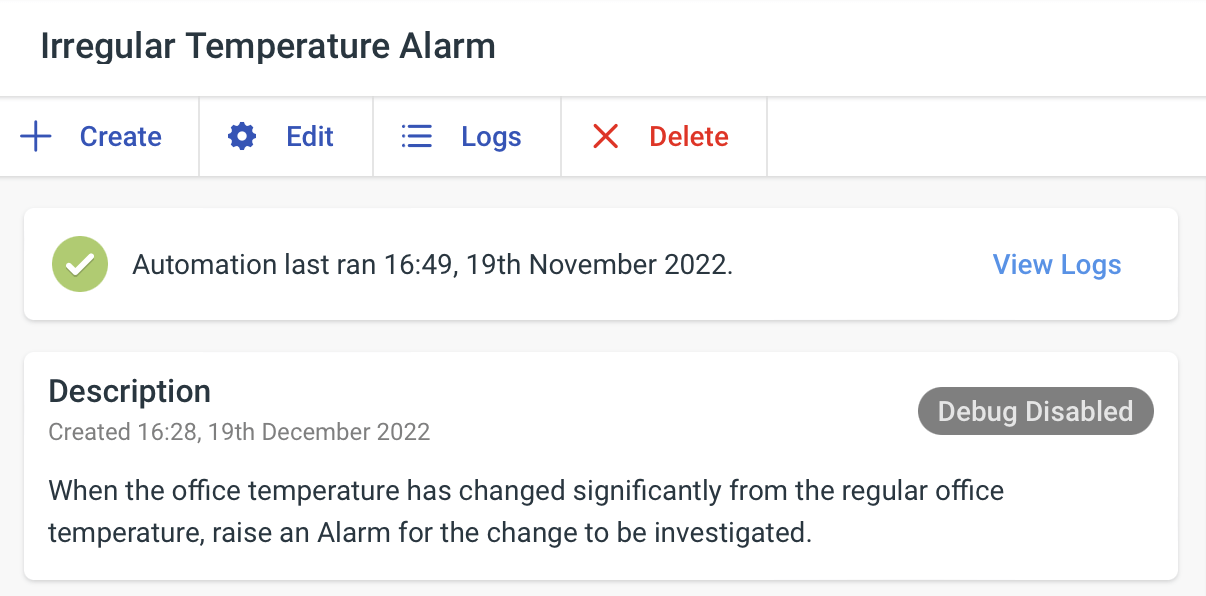
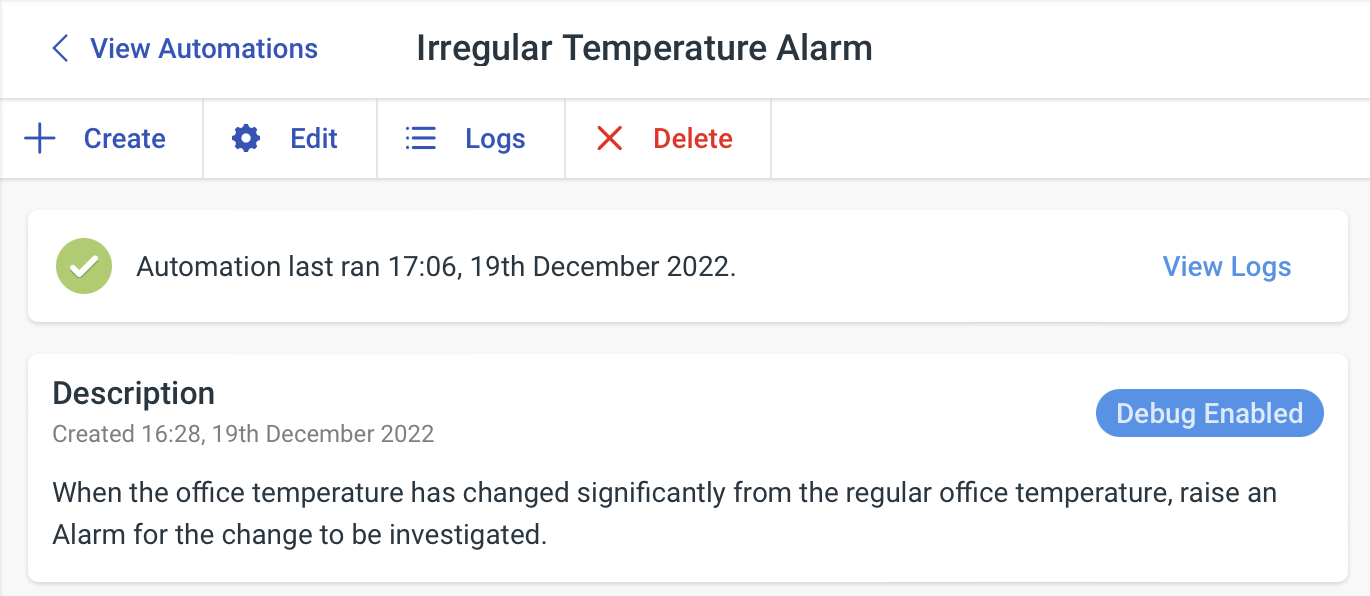
When viewing an Automation you'll now see information on when your Automation last ran, and how it performed alongside what caused your Automation to run. Clicking View Logs allows you to view further details for an Automations run.
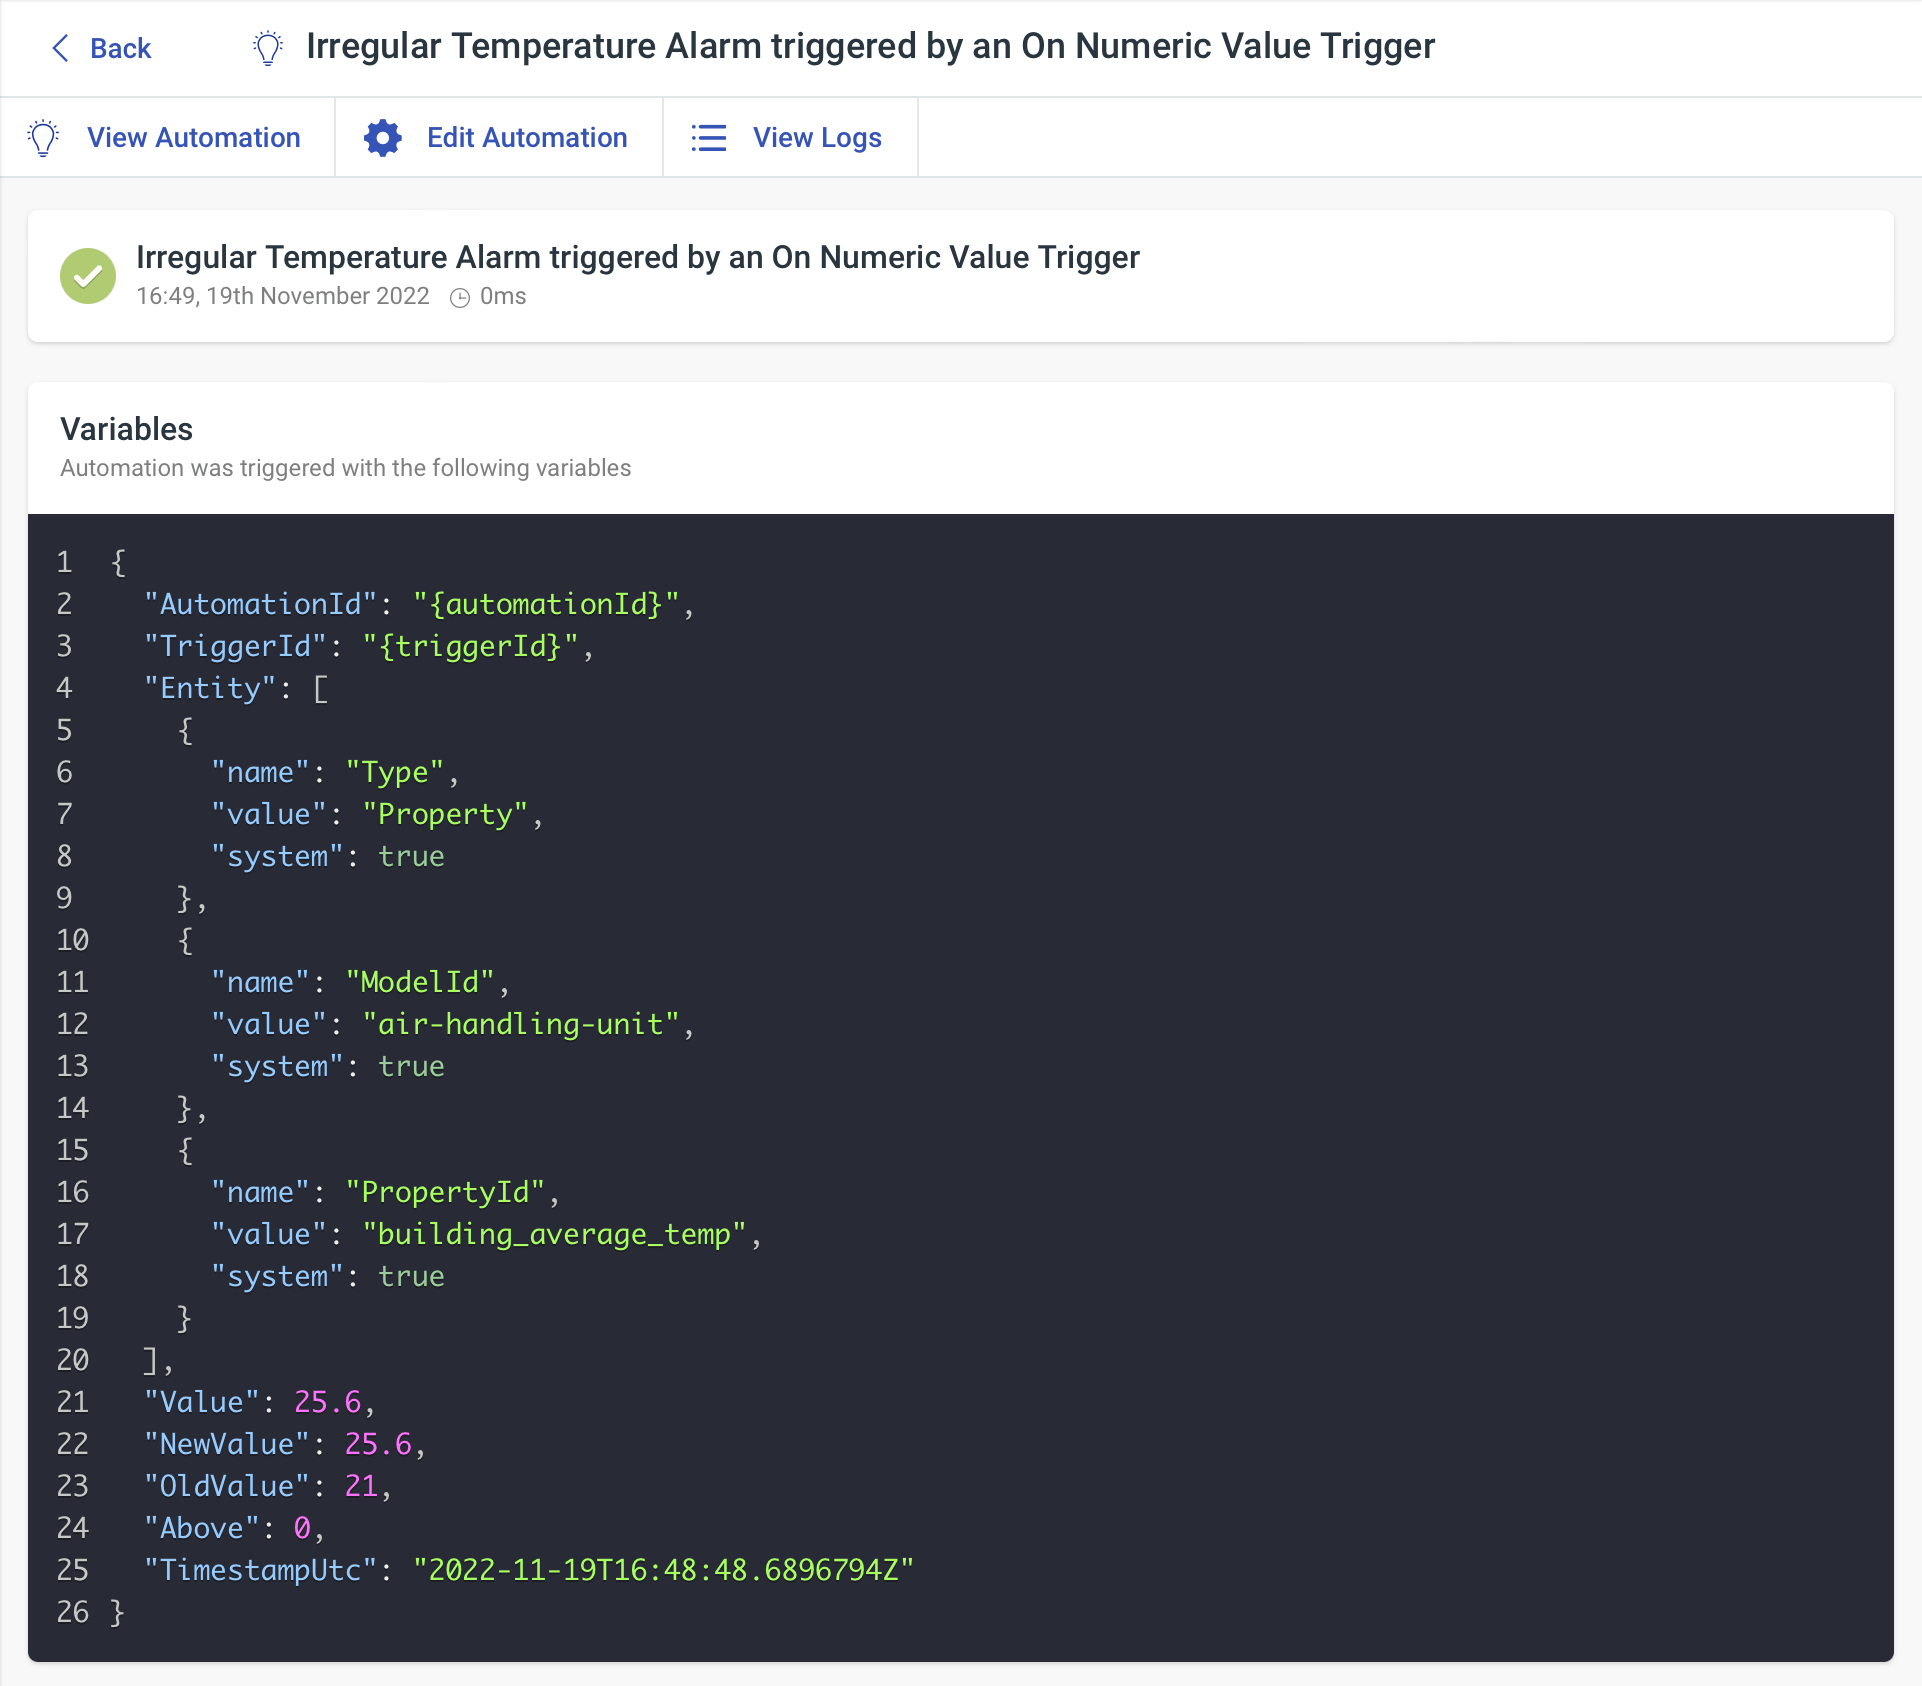
At the top, you'll see a top bar detailing which Automation ran, when and what caused it to run, with the overall status of the execution. Below that, you'll see a set of variables that were available in the Automation at the time of execution to help reference expected vs actual data inside the Automation.
The status badge will be red if there was an error, amber if there was a warning and green if the run was successful. If you're ever unsure, hovering over the badge will give you some guidance.
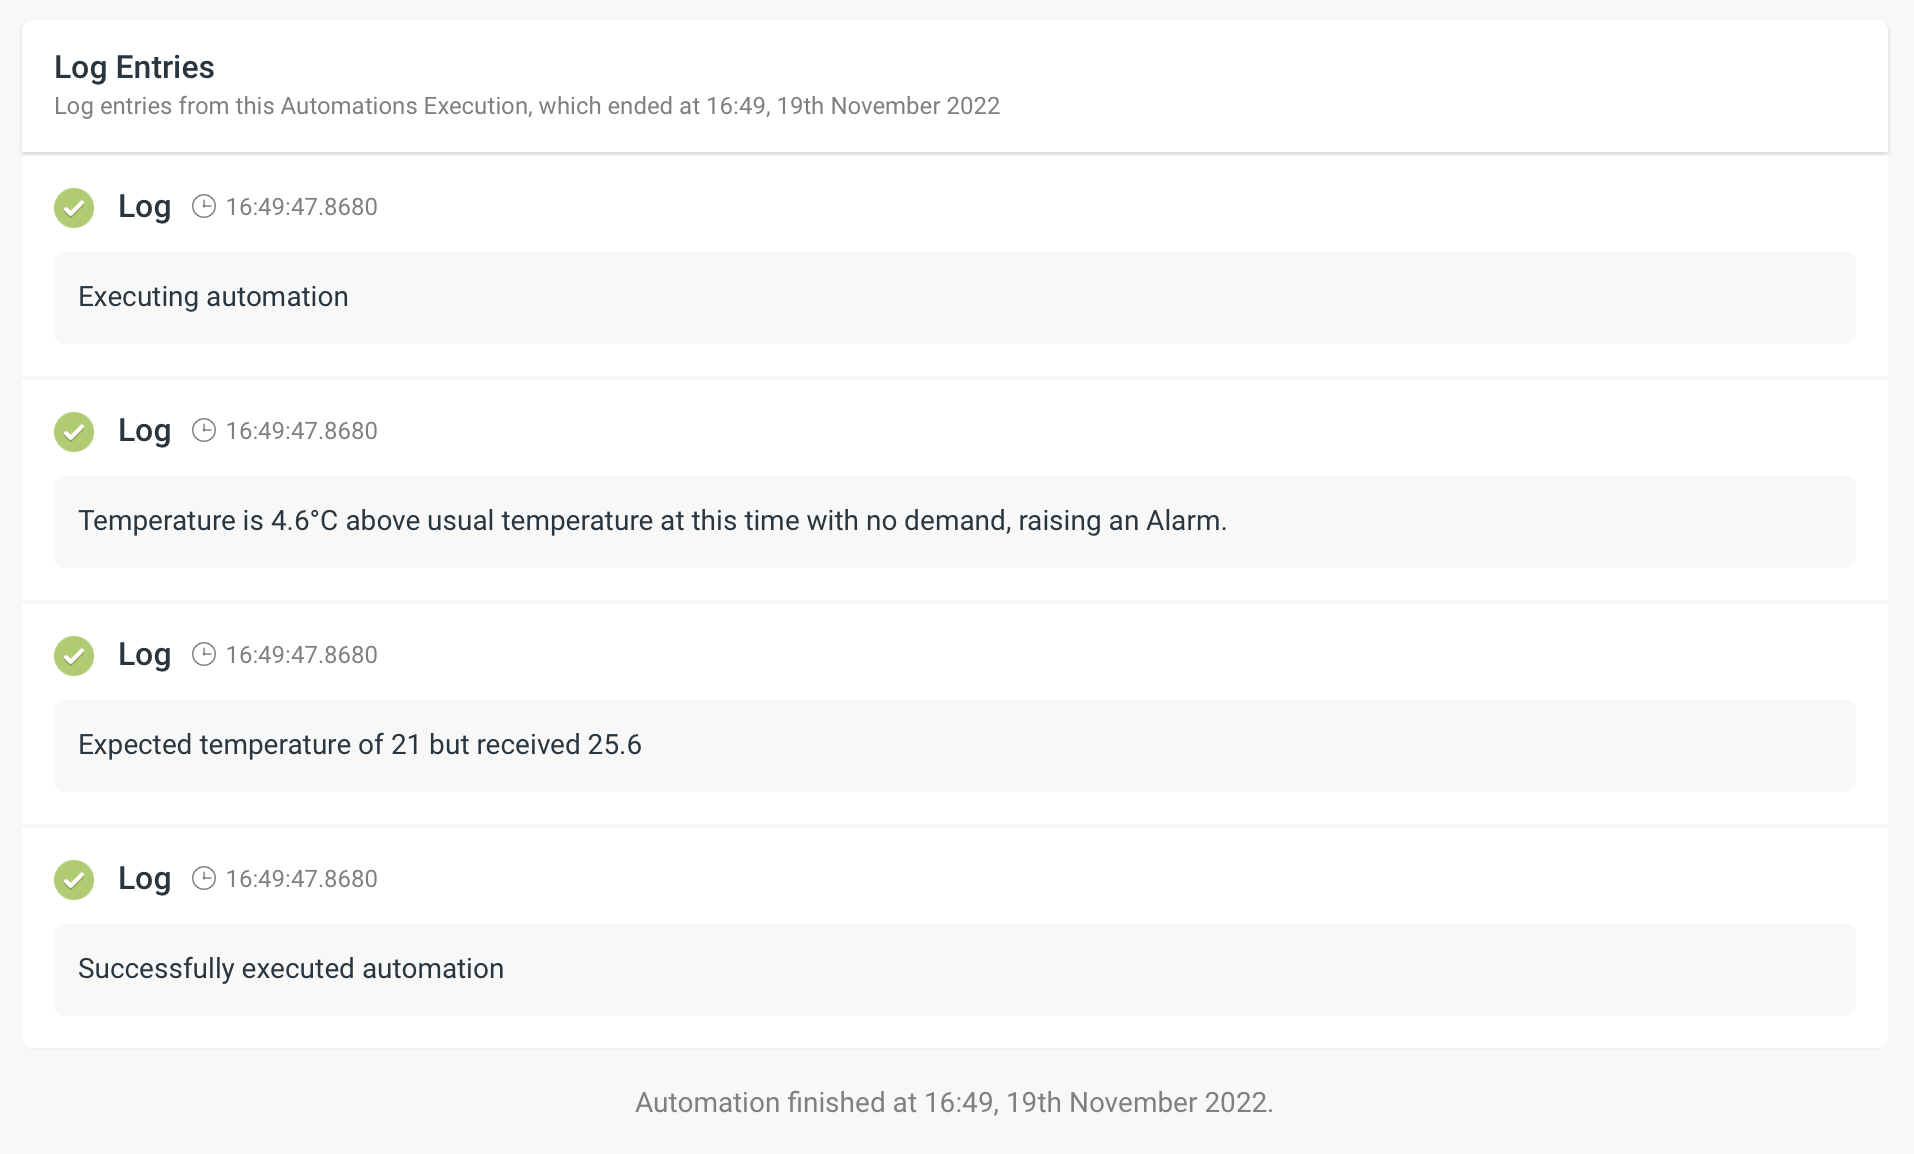
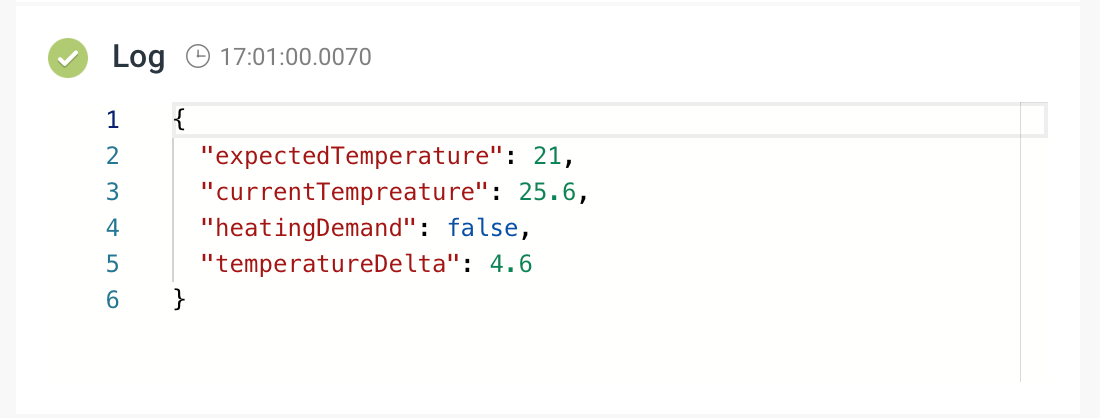
The Log Entries will detail each step, alongside any logs, from the execution with an overall status for each log. If a log message was an error or warning, you'll see this reflected visually in the badge next to the log message. When using the UDF Trigger, Condition or Action, console.log(), console.debug(), console.error() and console.warn() will output information in to the log entries to help debugging.
As a nice addition, any large structured data will be presented formatted nicely in a readonly code-editor window with support for common features such as CTRL+F (find) and collapsable sections.
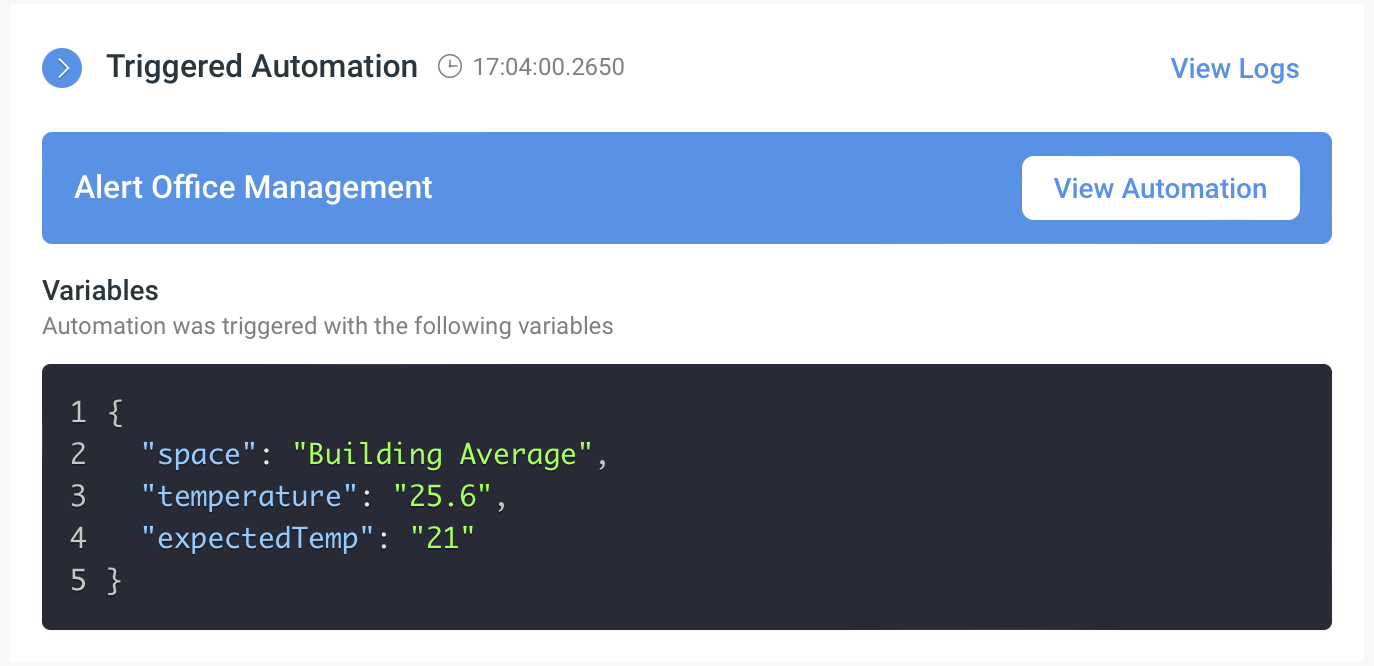
If an Automation triggered the execution of another Automation in the Hark Platform, you'll see this inside of the Log Entries with what Automation was triggered and the variables used to trigger said Automation. Clicking View Logs will show you the details of how the triggered Automations execution performed.
If you'd like to see the latest runs for your Automation, you can do so by clicking the Logs button in the action bar when viewing an Automation. Each row contains an overall status, information about when the Automation triggered and what caused it to help you see at a glance how your Automation is performing. Click a list item to find out more detail about a run.
Automations Debug Mode
Debug mode is a new feature for Automations which when enabled will output more detailed logging for every Automation run. When viewing an Automation you'll see a new Debug enabled or disabled badge that shows whether Debug is enabled or disabled for an Automation. When an Automation runs with Debug enabled, you'll see a similar badge on the Automation logs.
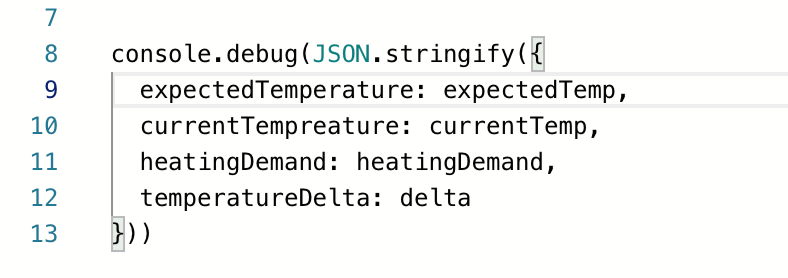
Pro-tip: If you'd like to have helpful debug logging inside of a UDF Trigger, Condition or Action, but don't want those logs being output all of the time, using console.debug() in your UDF will have those messages only logged when debug mode is enabled!
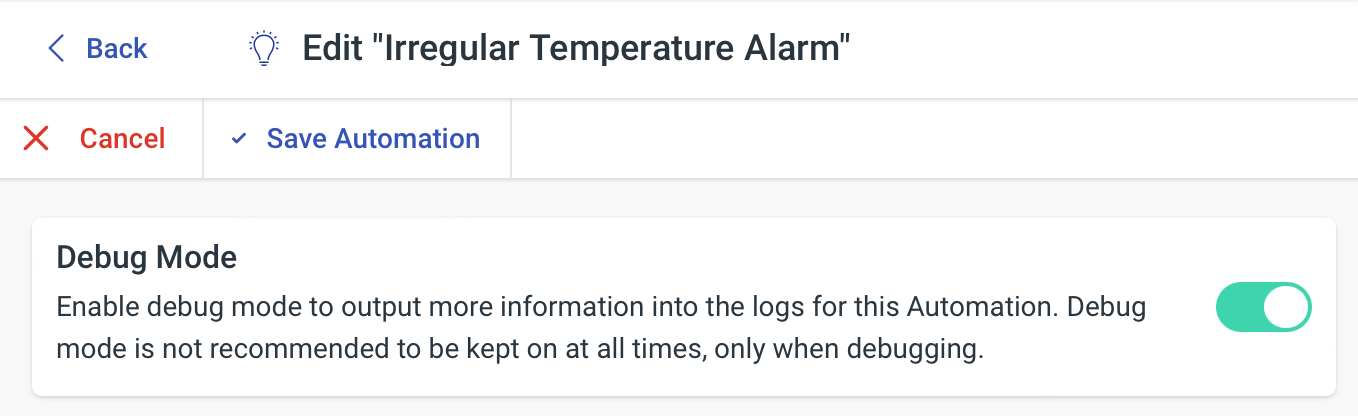
To enable or disable debug mode on an Automation, click Edit to edit the Automation and toggle it on or off, saving your changes afterwards.
View Alarm Attributes
Each instance of an Alarm features a dynamic set of Attributes that are set when an Alarm is activated. They are often used for attaching information such as why the Alarm was raised, metrics (such as temperatures, humidities, energy consumption) at the time in which the Alarm was raised and any other useful information.
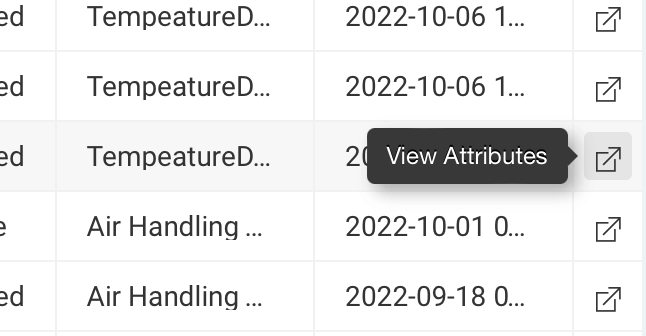
Now when viewing a list of Alarms in the Hark Platform, whether it's under a Models Alarms or the Alarms History Table widget on a Dashboard, clicking the expand button on the far right of a row will show you an Alarms attributes for further analysis.
Adapters
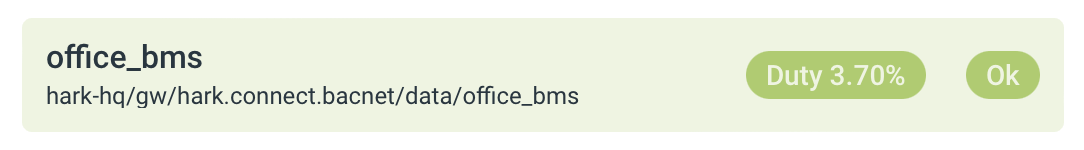
Duty Cycle Information
In November we've added some further information to the status for each device configured on an Adapter to help with monitoring your Adapter in the Hark Platform. Each configuration will now feature a Duty Cycle percentage which tells you how long the Adapter spent reading data from a device as a percentage where a lower duty cycle is better than higher.