April 2022
Today we're releasing the next step for the Analytics module, alongside significant additions to the Twin Engine with the ability to create Automations, manage Ingresses and create Alarm strategies in the Hark Platform.
Twin Engine's Automations are extremely powerful, allowing you and your team to model business processes, alarm strategies, integrate with external services and more.
The Analytics module is taking a giant leap forward by centralising all Hark Platform resources in one hierarchy. Understanding, and managing, your Organization in the Hark Platform has never been easier. Alongside the new hierarchy, we've added some significant features to help you build a hierarchy that gives you the information you need at each level.
Analytics
Hierarchy
We have redesigned the Analytics module from the ground up with a single focus in mind: a centralized hierarchy. Our new hierarchy within Analytics is extremely powerful, and helps people understand the structure of your Organization better than ever.
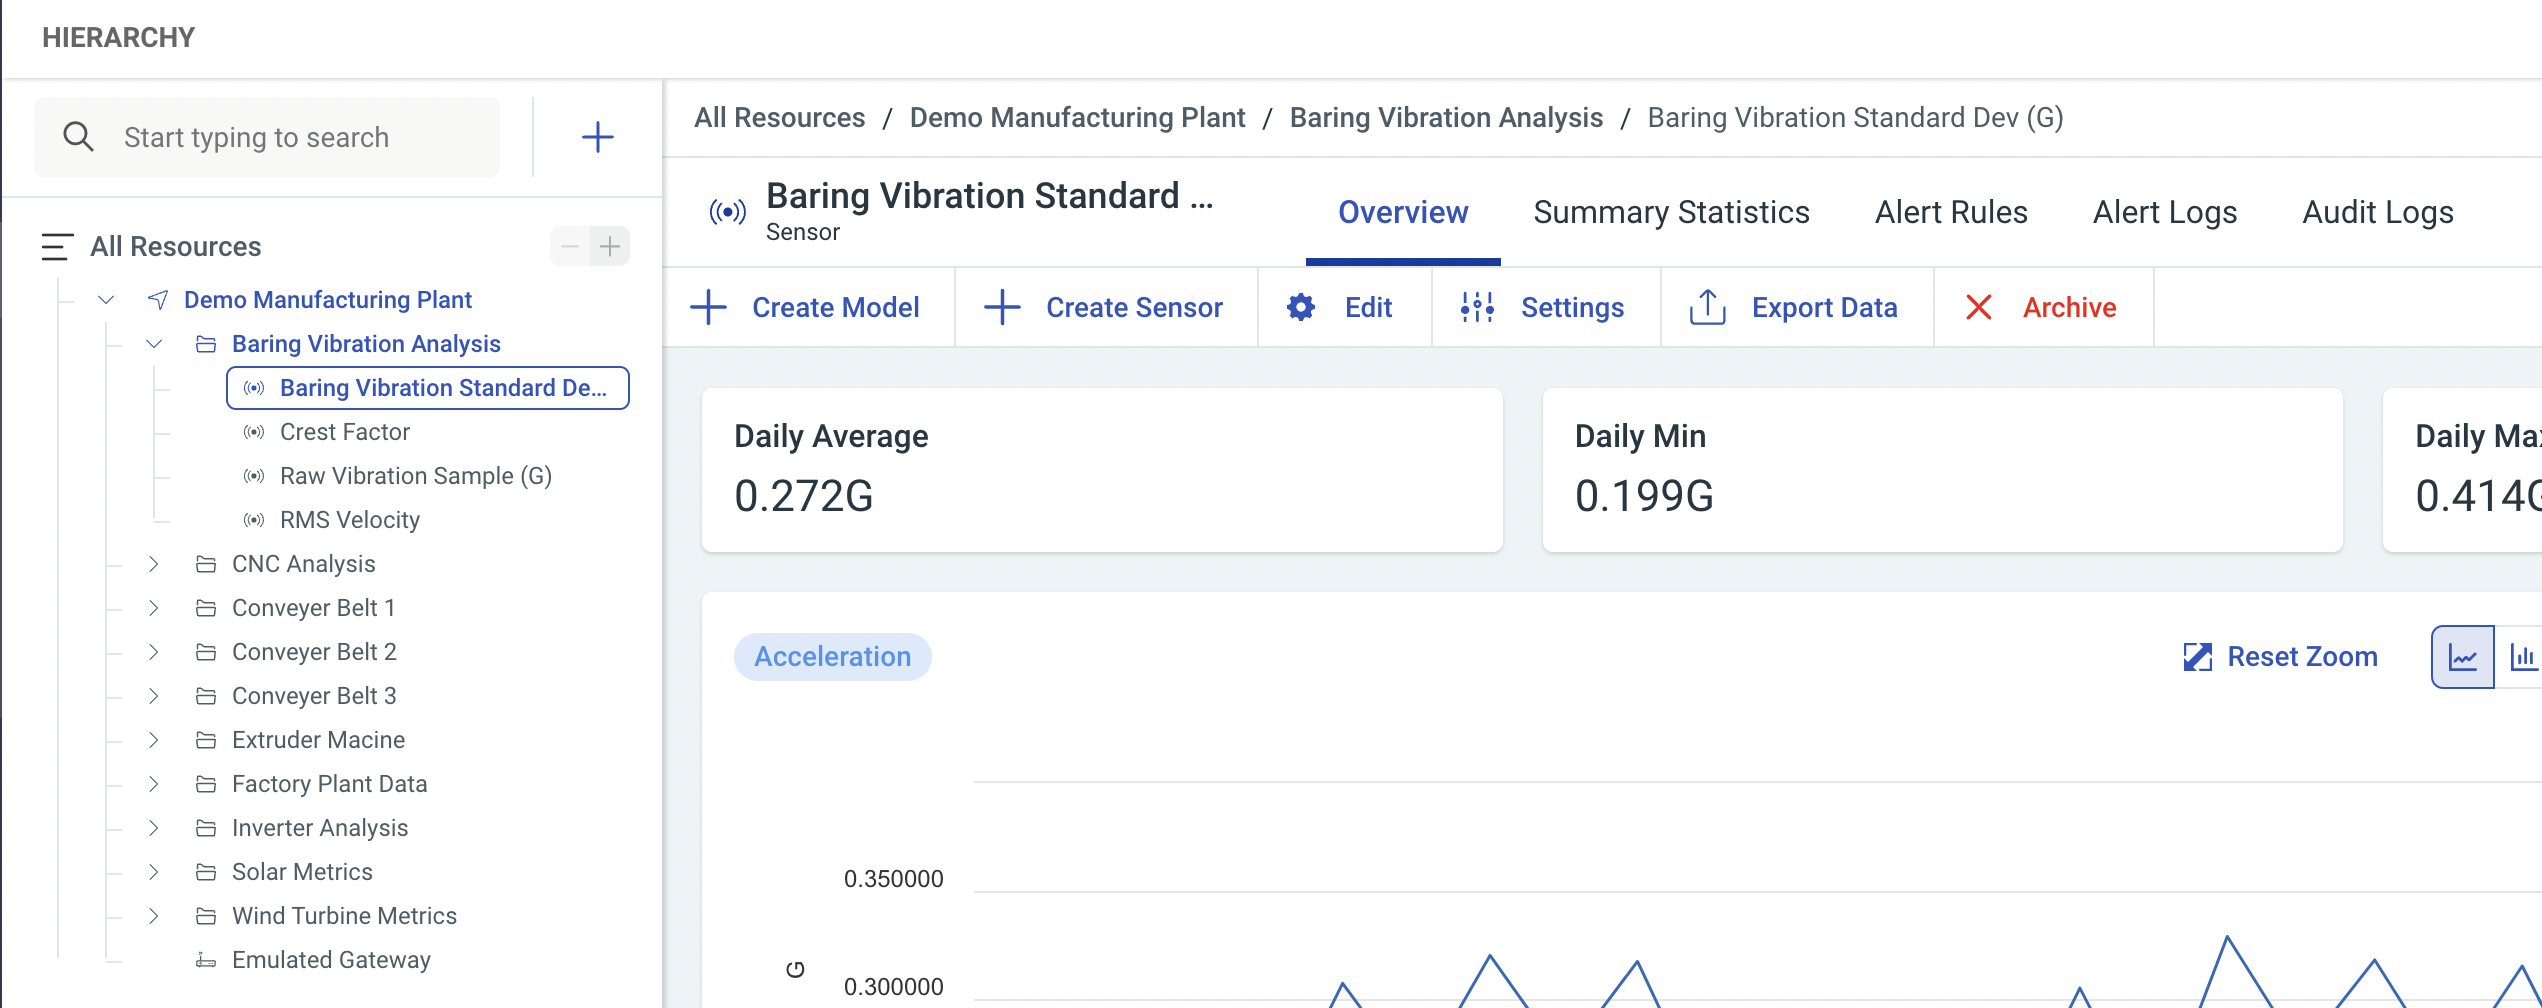
When visiting the hierarchy you'll see your Locations, Groups, Sensors, Gateways, and for the first time, Twin Engine Models. We're working to add more to this hierarchy over time. You can even search the hierarchy to find what you're looking for much faster.
When clicking on an item in the hierarchy you'll be presented with a that items information and views. For example, when clicking on a Sensor you'll see the averages, real-time data graphs and be able to perform familiar actions against that Sensor.
Adding to the Hierarchy
We've designed a new way to quickly create resources in the Hark Platform, right within the Hierarchy. Using the new Create Resource button you can create a Location, Group, Sensor or Model wherever you are in the hierarchy.
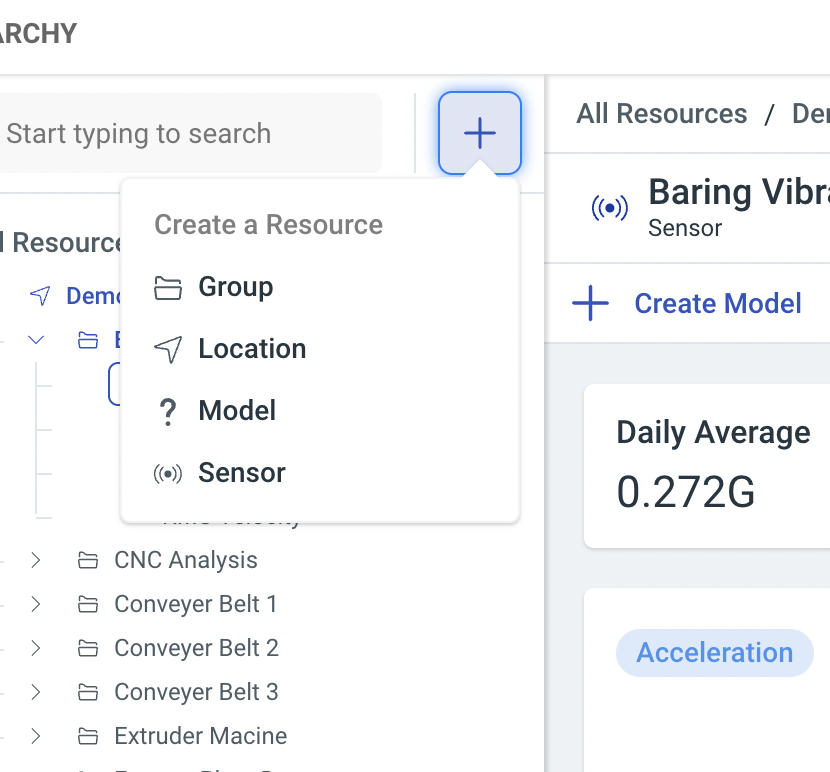
When creating a resource, we'll pre-fill the forms with information around your current context in the hierarchy to reduce time spent configuring your Organization. You can always change these values if you need to.
Dashboards
Our fantastic Dashboarding capabilities are now integrated with the Analytics module by allowing you to embed your Dashboards within each level of the hierarchy. This functionality means you can provide custom visualizations throughout the hierarchy that makes sense for the item you're viewing in the hierarchy.
For example, you configure the Dashboard to show the information you need to see for each Location in your hierarchy.
Sensor Line Overlays
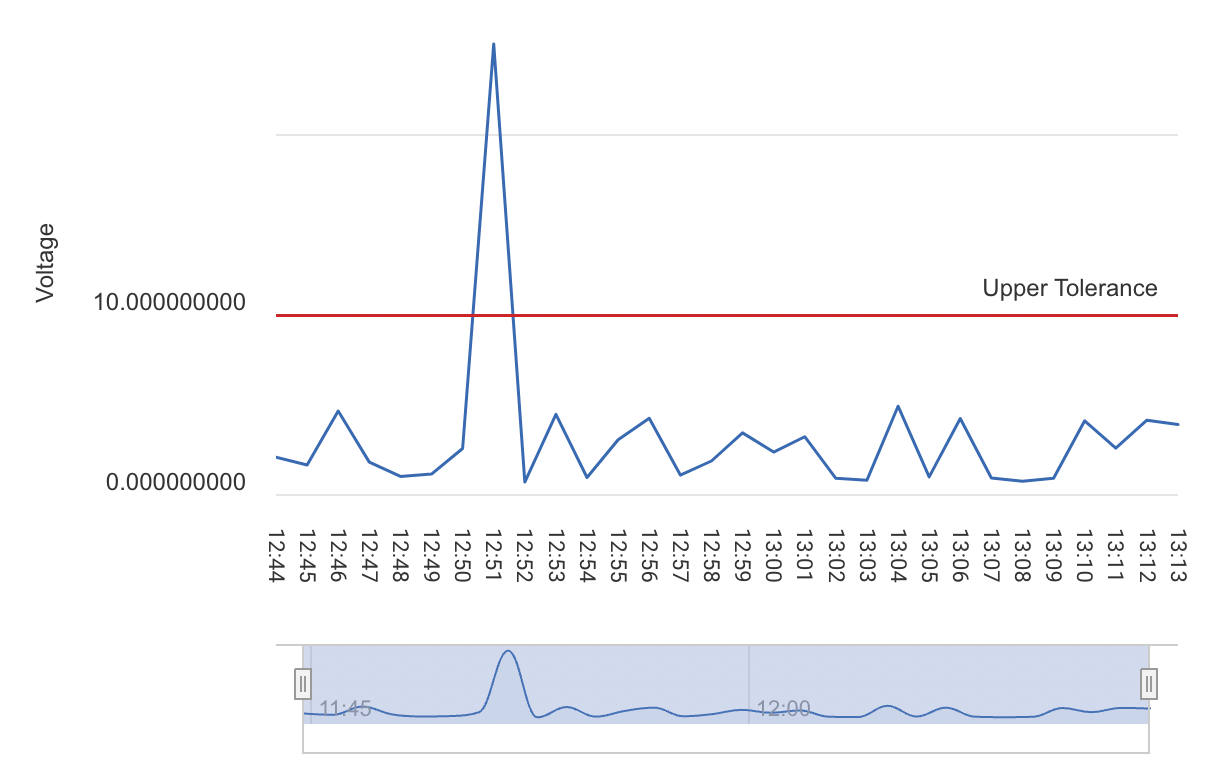
Our brand new Sensor Line Overlays feature allows you to visually see how your Sensor is performing as regards to a set of boundaries. By defining line overlays on a Sensor, you'll be able to see if your Sensor's data has gone above or below a tolerance in a glance.
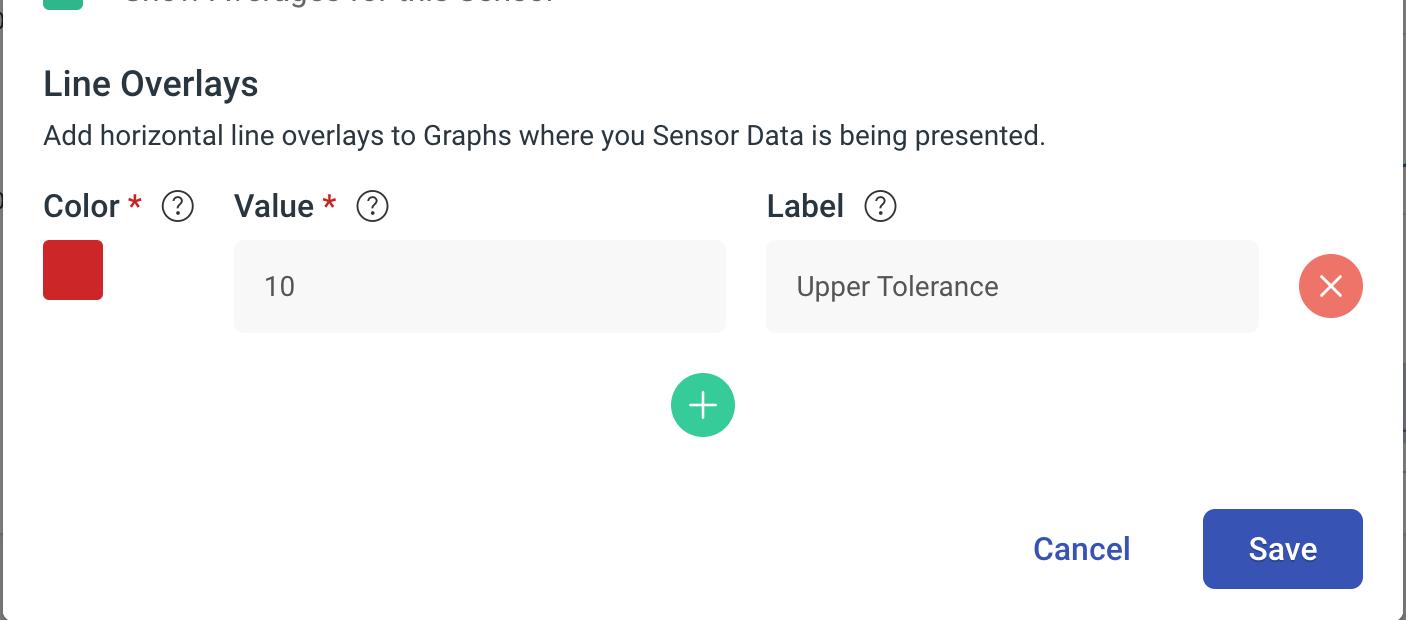
Under a Sensors settings you can configure as many Line Overlays as you need. Enter a value, give the line a colour and add an optional label. When configured, your Sensor's graphs will have glanceable overlays for you to help understand how your Sensor is performing.
We've also included the configured overlays in the Sensor Comparison Widget.
Locations & Groups
Amongst many other quality of life improvements for Analytics, we've added the ability to rename Locations and Groups to help you tweak your Organization over time.
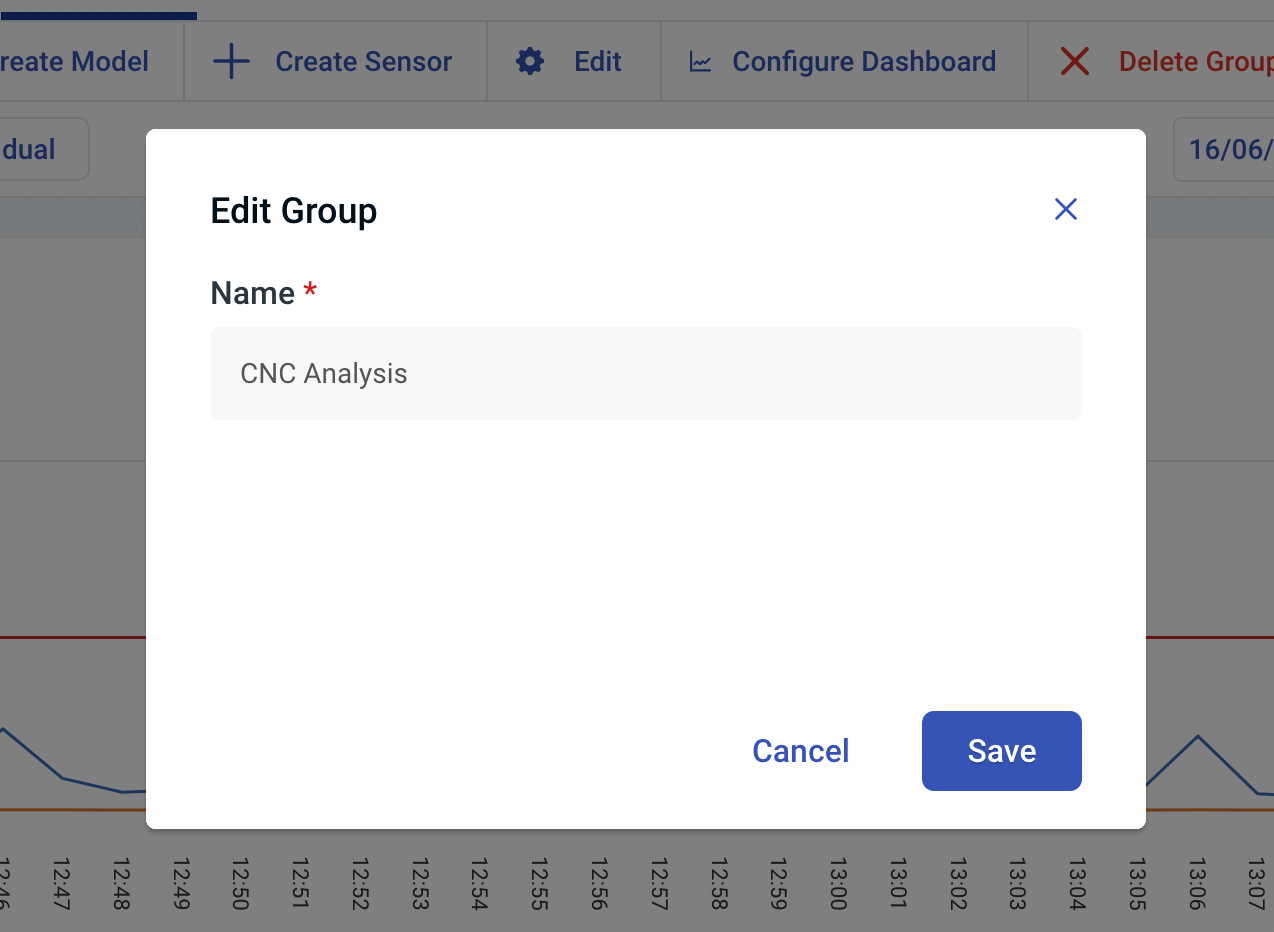
When viewing a Group or Location, click Edit, enter the updated name and click Save.
Twin Engine
Last month, we released our powerful Automations feature within the Twin Engine, and today we're taking another huge step to help our users create their own Automations. Along side creating an Automation, we're releasing native support for Alarms within the Twin Engine, and improving our connectivity.
Create Automations
Starting today, you can now create your own Automations within the Hark Platform. You can create a Model Automation by viewing a Model and clicking Create Automation, or create an Organization-wide Automations under the Automations area in the Twin Engine.
To learn more about creating Automations, read our Create an Automation guide.
Automations are made up of Triggers, Conditions and Actions, and we're releasing a whole bunch of them to get you started with modelling your business processes, alarm strategies, integrations and more within the Hark Platform.
Brand new Triggers, Conditions and Actions
- Triggers - Schedule, MQTT, Numeric Value Tolerance, Value Change, Webhook Integrations and Alarm Activated, Updated or Cleared
- Conditions - Numberic Value Tolerance, Time of Day, Value Change
- Actions - HTTP Request, MQTT Message, Set a Model Property, Send an Email or Active, Update or Clear an Alarm
Alarms
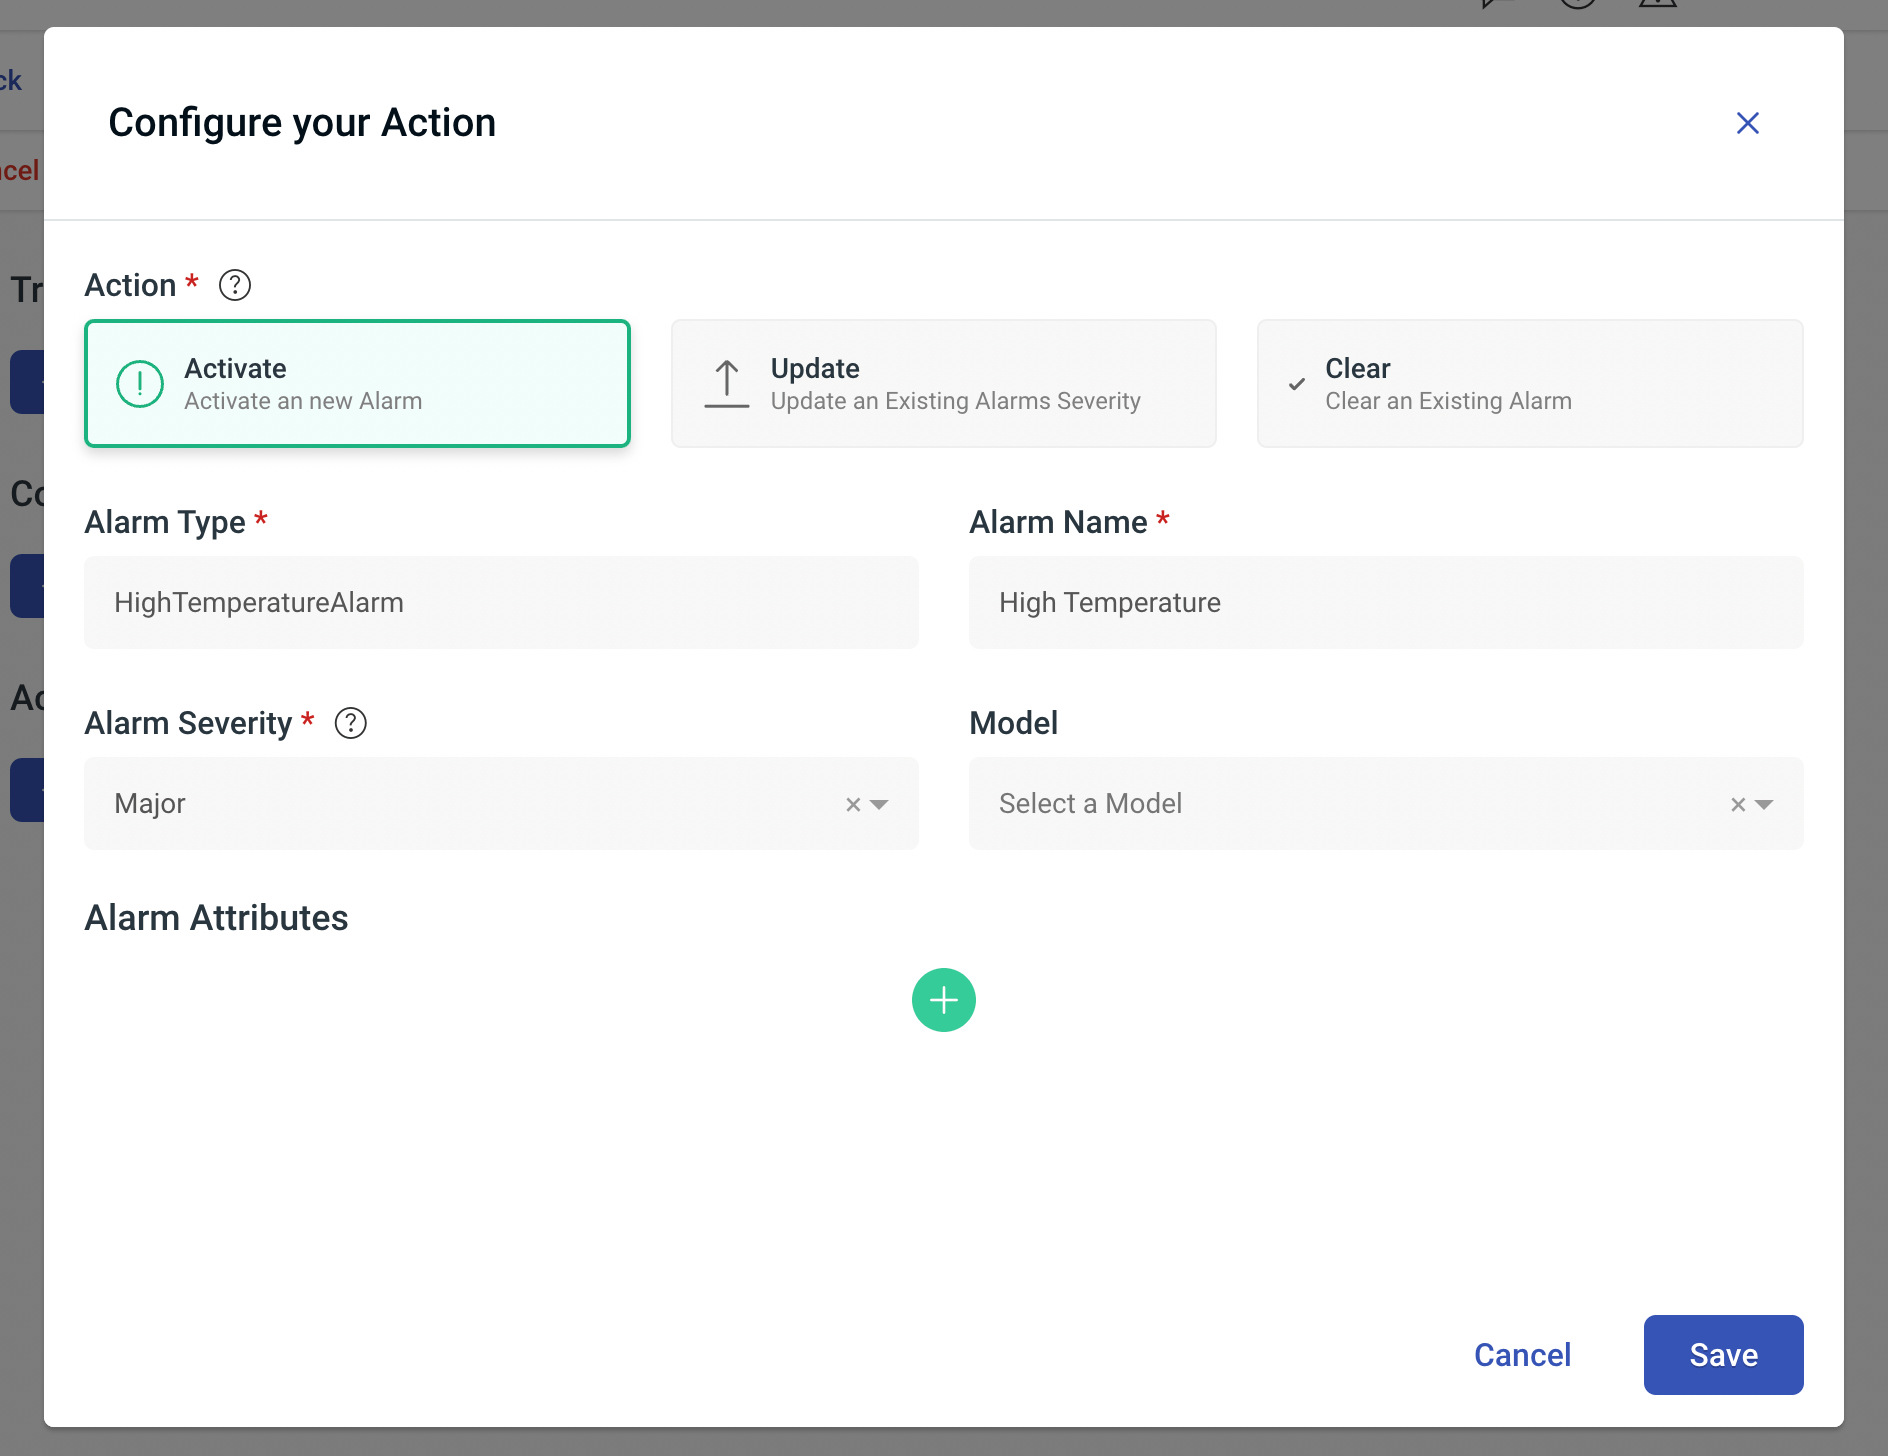
In April, we've built a brand new way to manage Alarms within the Hark Platform. Using Automations, you can build powerful and customisable Alarm strategies to model your business processes in any way you need to.
Create Automations to activate Alarms when your data goes out of tolerance, automatically update an existing Alarms severity if a problem is getting worse, automatically clear Alarms if an issue has been resolved, or whatever you need to do.
Viewing your Alarms
When Alarms have been activated, updated or cleared you'll need to be able to view and manage them. When viewing a Model, you can see the history of your Model's Alarms by clicking the Alarms tab.
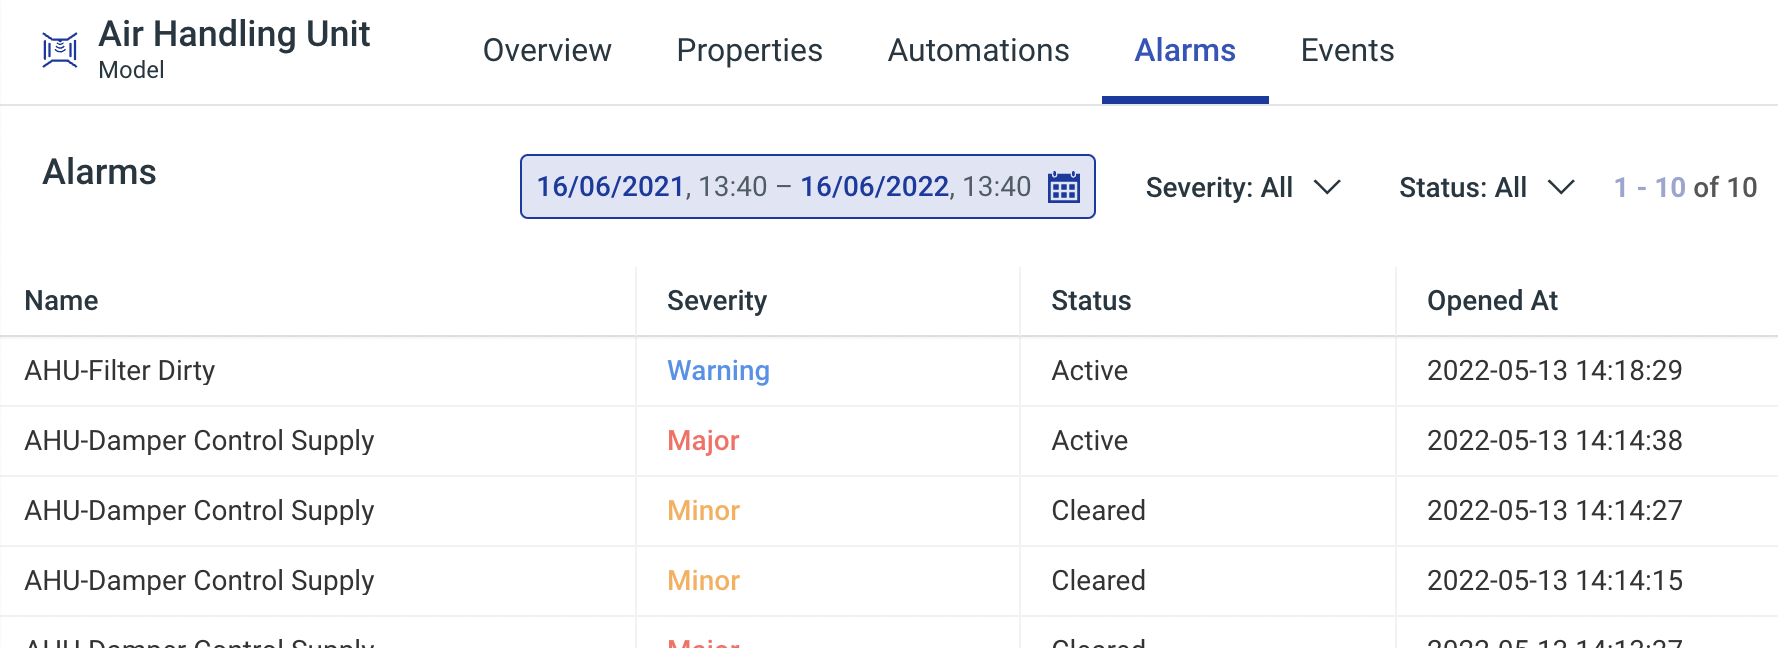
View the latest Alarm history for your Model and use the powerful filters to find what you need to. By clicking on a Alarm, we'll filter the list by the type of Alarm clicked.
Manually Closing an Alarm
Some Alarms may require manual closing and because of this, we've added the ability to manually close an Alarm in a click. When viewing your Alarms under a Model, simply click the Clear Alarm button to do so.
Ingresses
Ingresses are an important part of ingesting telemetry data in to the Twin Engine. They allow you to take incoming data and set Model Property values or raise Events automatically.
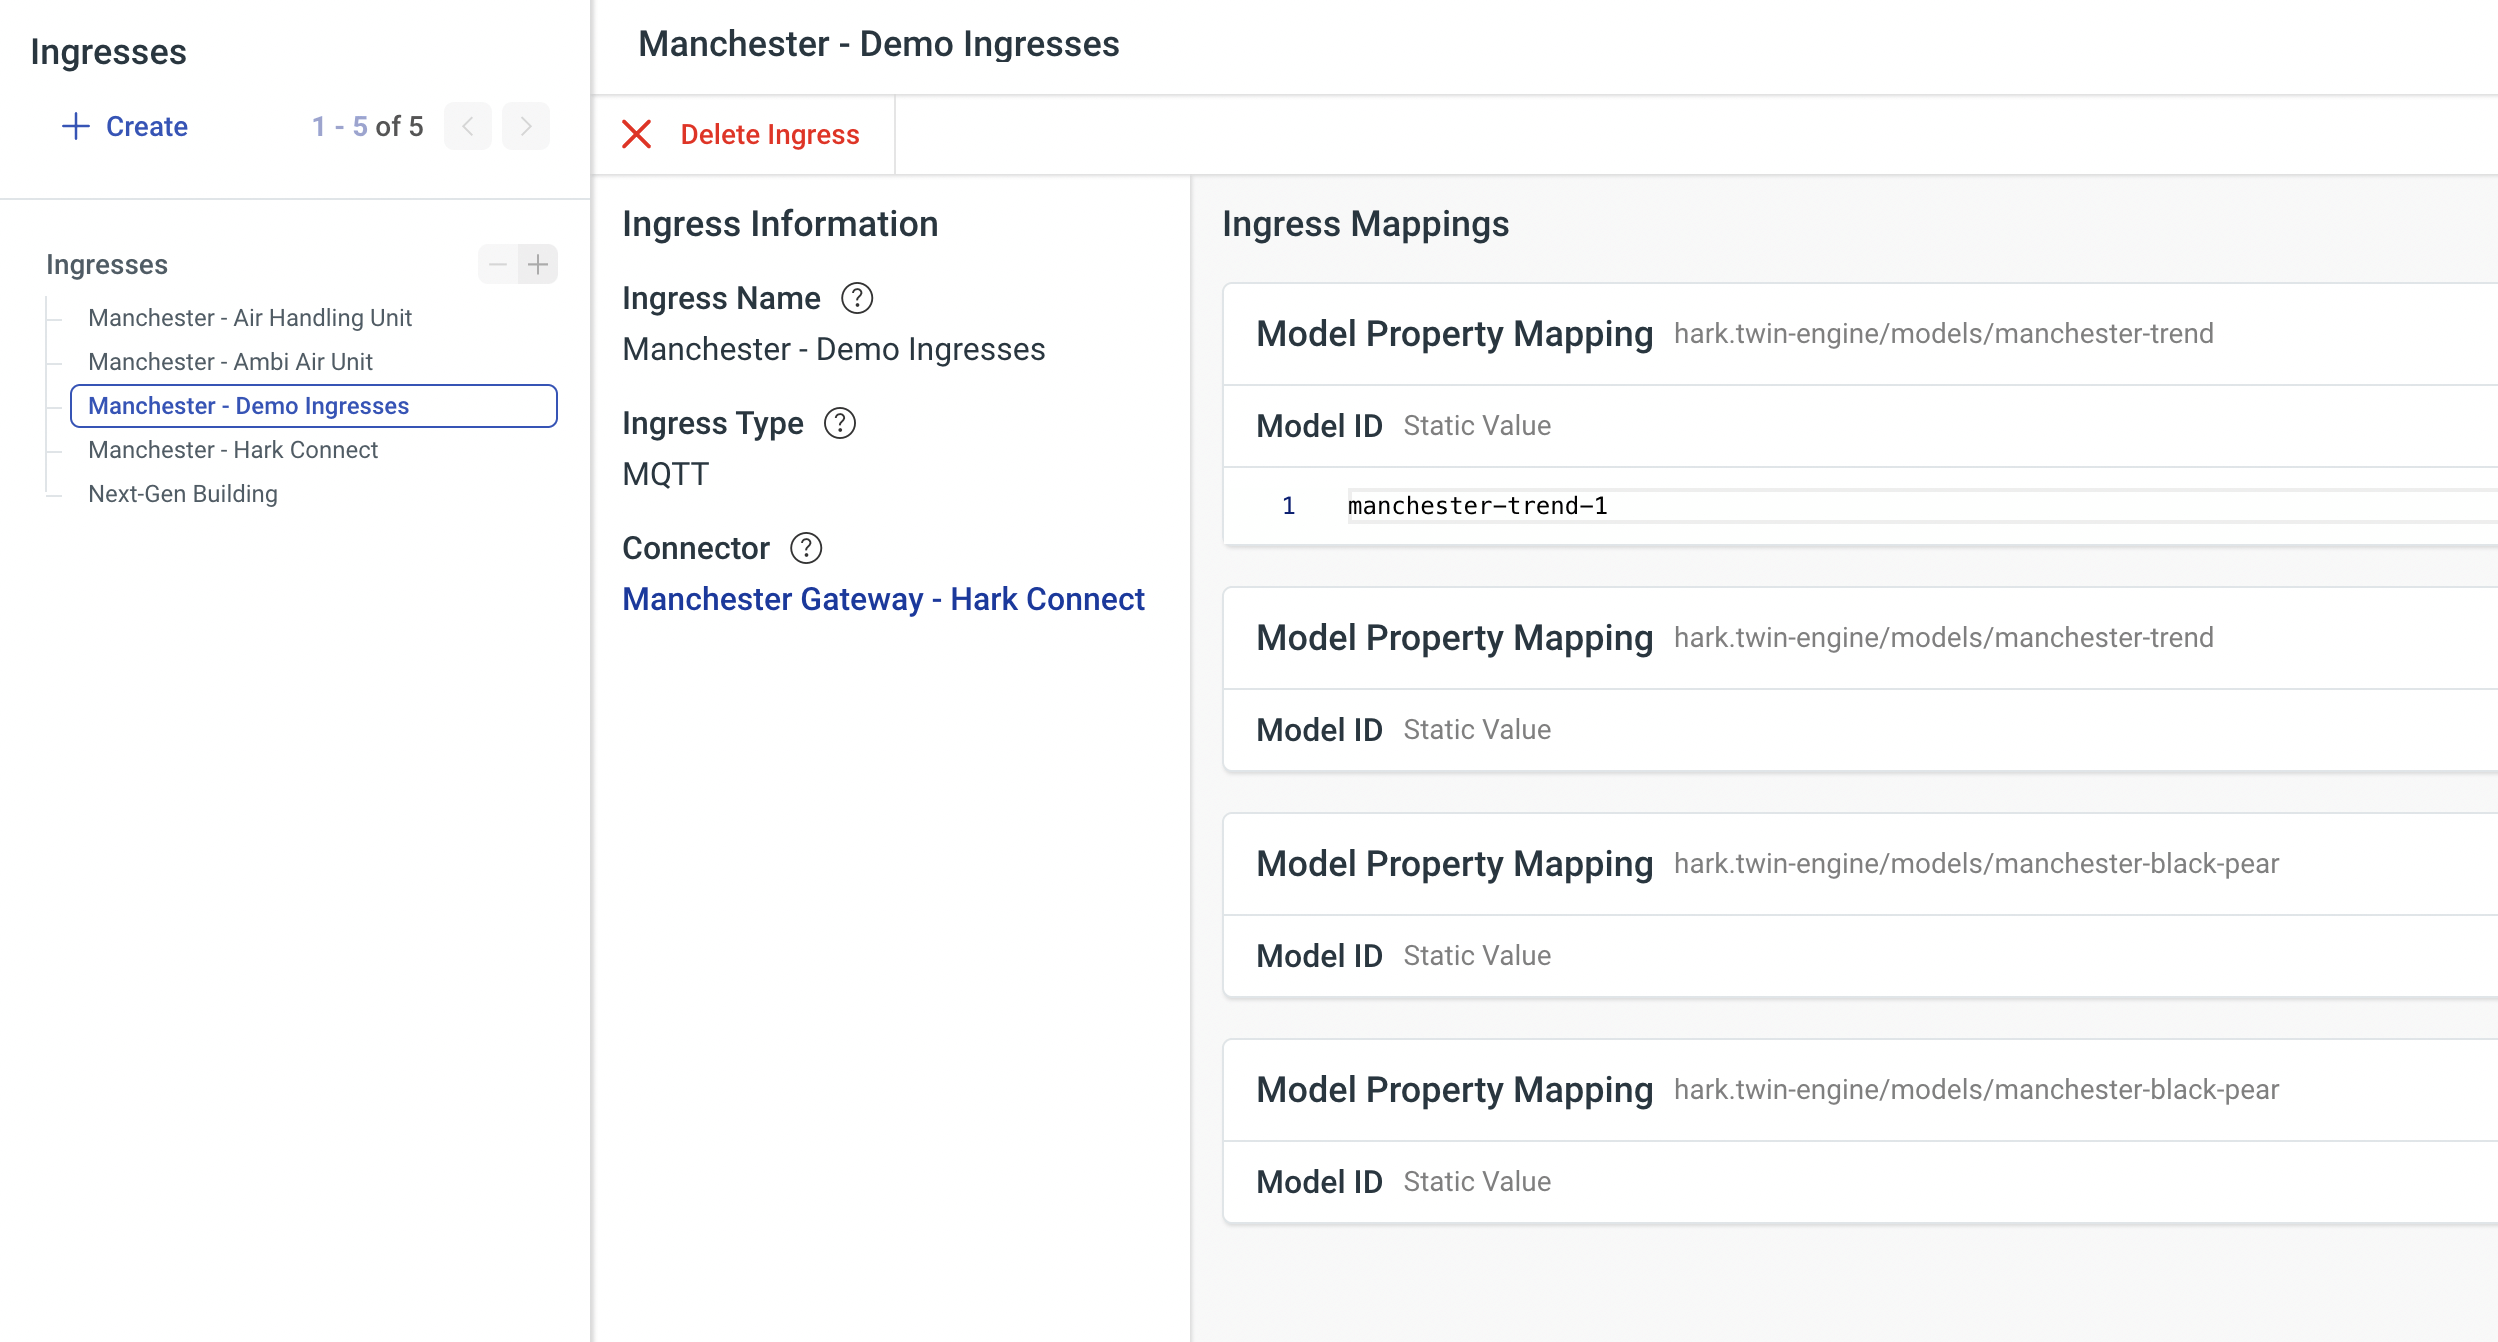
Today we're releasing brand new functionality for you to view and manage your Ingresses in the Twin Engine. Under the Ingresses area, you'll see a list of your configured Ingresses and clicking one will show you the details of what that Ingress does. If you need to delete an Ingress, you can so in a click.
To learn more about Ingresses, read our Introduction to Ingresses guide.
SMTP Connector
You can now configure an SMTP Connector within the Twin Engine to use within Automations. When configured, you can send emails directly from Automations whenever you need to alert people, integrate with other services or just get some information quickly and in an automated fashion.