Adding a Widget to a Dashboard
Adding a Widget to a Dashboard is really easy, intuitive and helps you pull out the information, sensor data and analysis you want to see in your Dashboards.
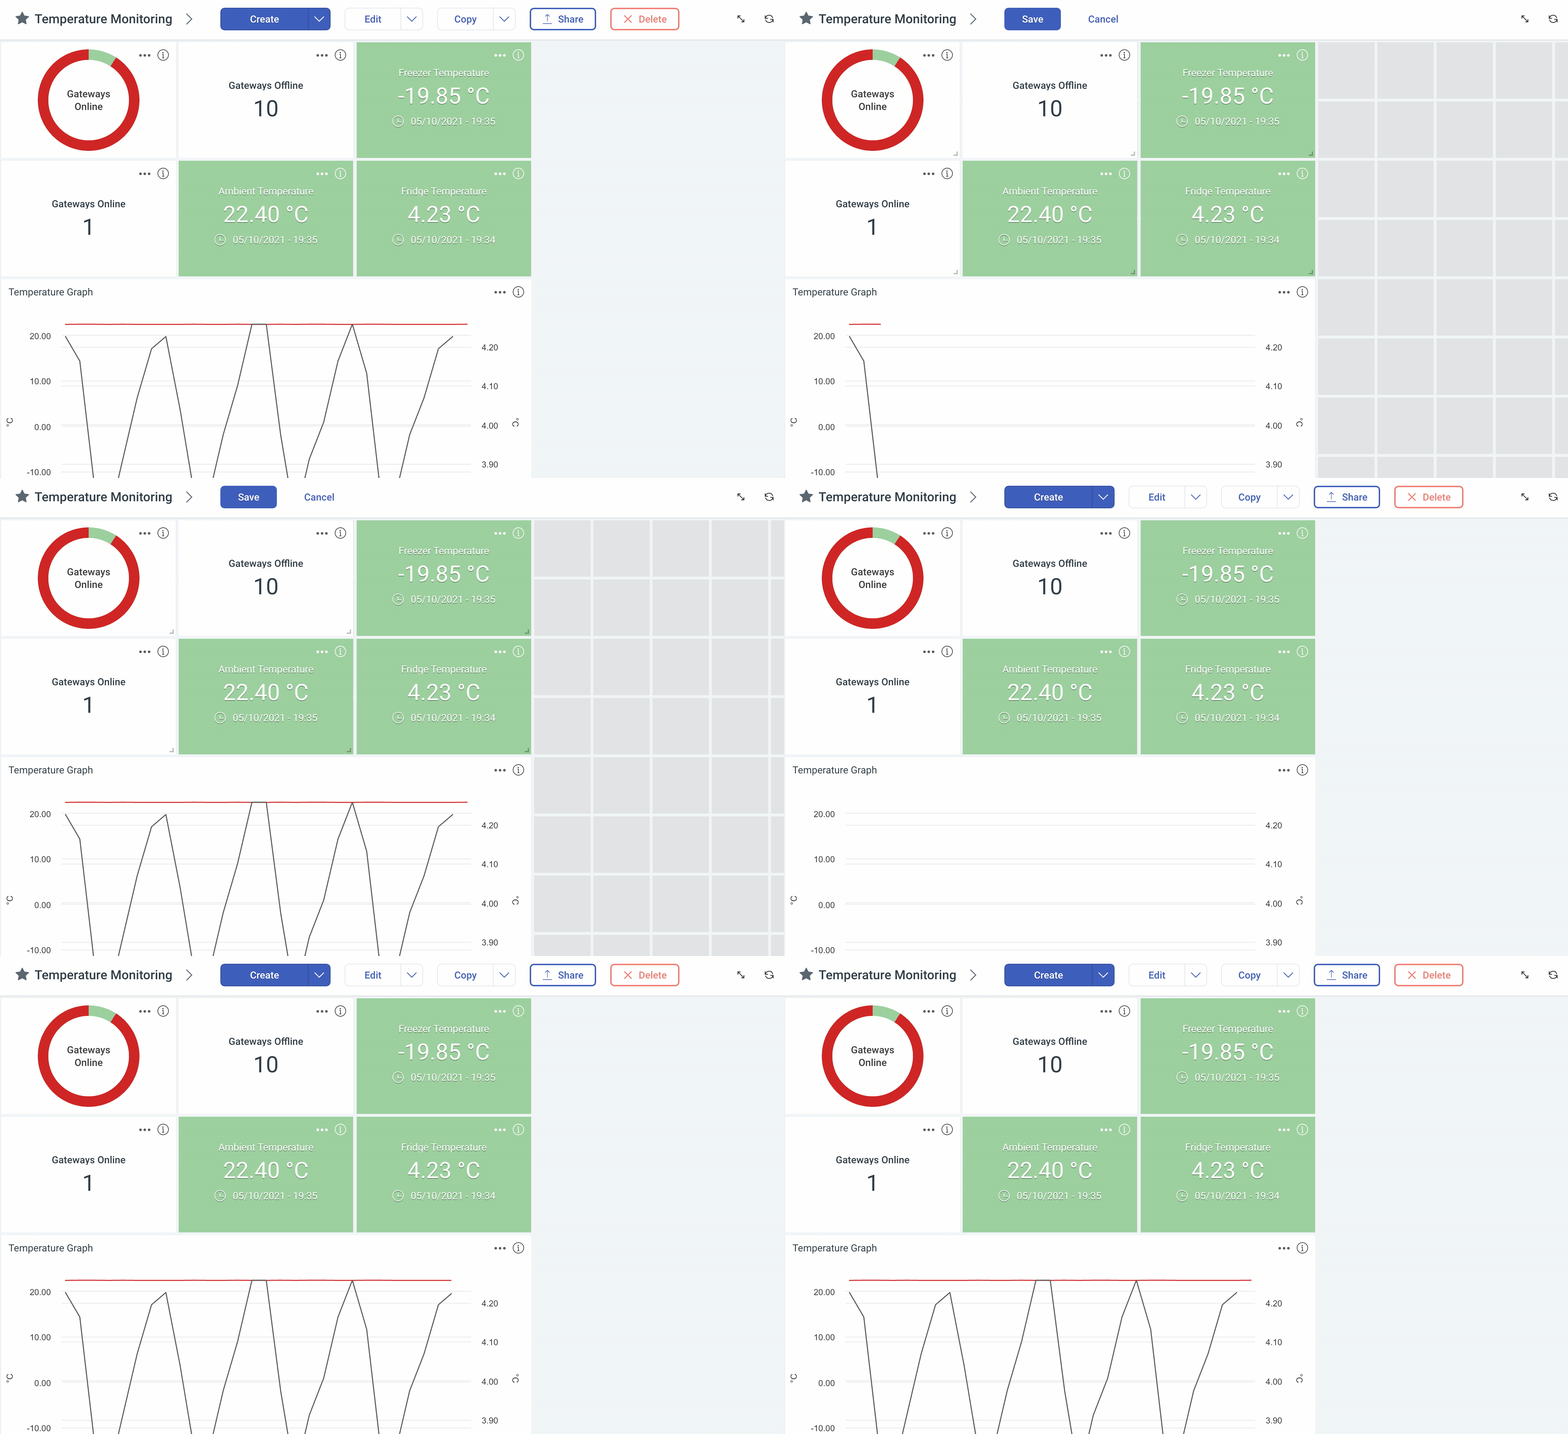
To add a Widget, start by clicking Edit in the dashboard's control bar. You’ll know you are in edit mode when your Widgets show a grid behind them.

The grid shows you where you can add Widgets to a Dashboard. As you move your cursor around, you’ll notice a box highlighting your active cell, in the grid.
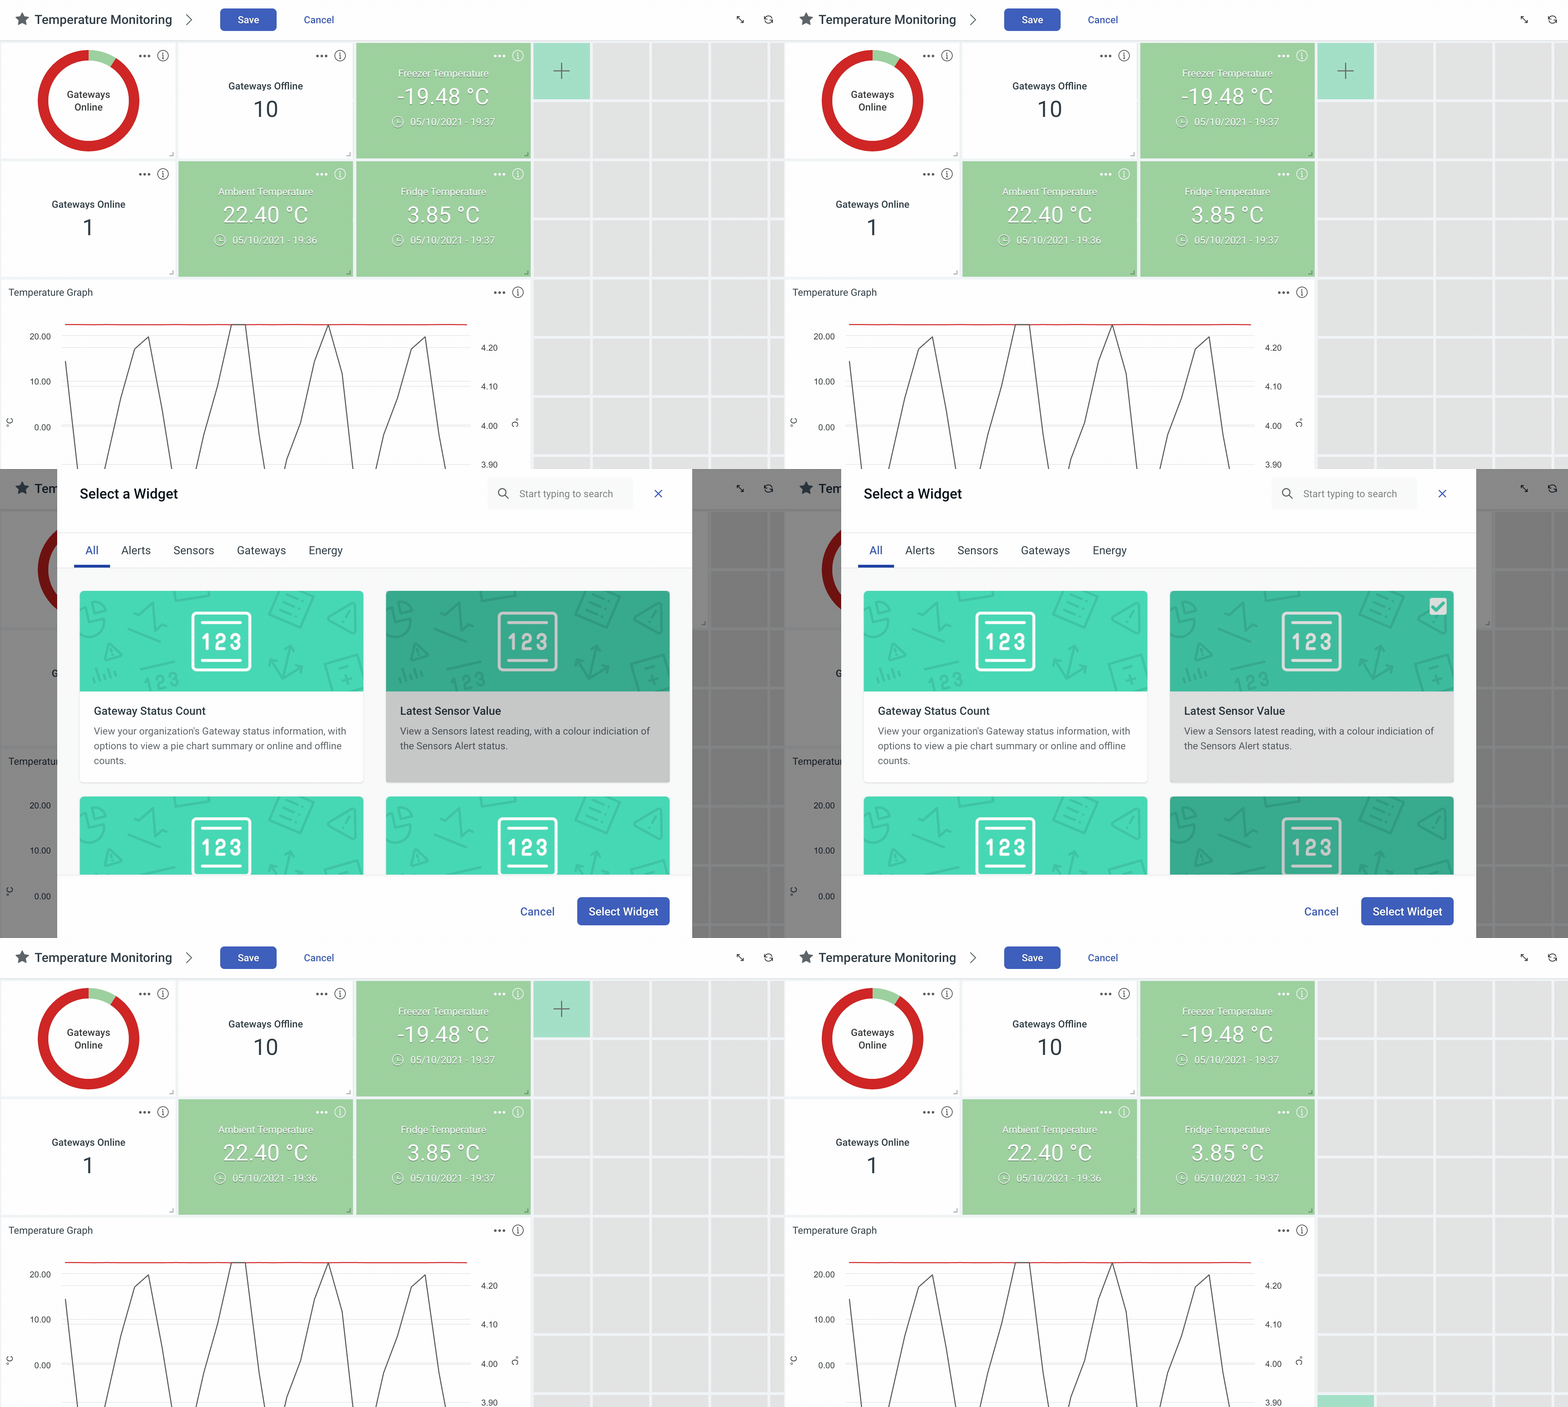
Adding Widgets starts by drawing out where you’d like a Widget to go. Click and drag to draw a box on the grid, and when you release your mouse you’ll be able to select what Widget you want to go in the space you drew. You can cancel this at any time by pressing the escape key on your keyboard, or clicking Cancel.

When selecting the Widget you want, you may see some that do not fit the space you have drawn. Drawing a bigger space will allow you to select those Widgets.
Select a Widget by clicking on it, and clicking the “Select Widget” button. You’ll now need to configure your new Widget, and provide it with the settings it needs to show you your information.
Each Widget will have it’s own settings, and you can find out more information on configuring Widgets by reading our Configuring a Widget on a Dashboard guide.
When you’ve configured your new Widget, click the Save button to save the configuration of the new Widget. Please note that your new changes will not be saved to the Dashboard until you click on Save in the dashboard's control bar, to save the Dashboard's changes. Clicking Cancel will revert any unsaved changes to the last saved version of your Dashboard.
For further help with Widgets, the following guides may help: