
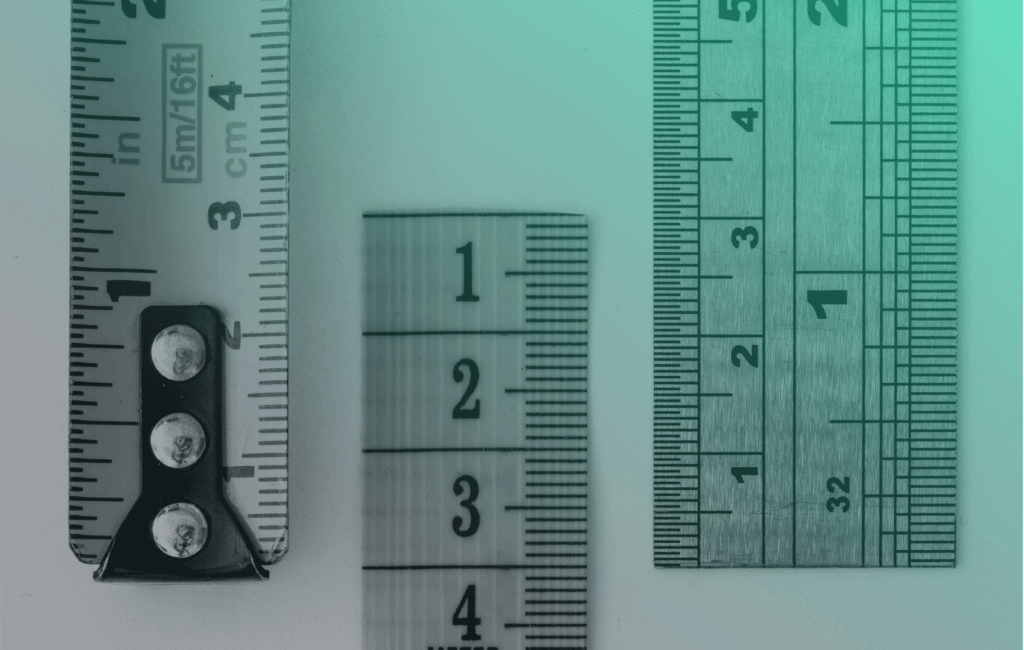
Data collected from sensors can range from energy in MWh, temperature in degrees celsius, velocity in metres squared, and so on… However when we want to plot multiple datasets together, perform statistical analysis or train machine learning models, having such a large range within our dataset can become problematic.
More specifically, when we build machine learning models, some algorithms calculate the distance between data points to make decisions based on the data. Therefore, it is useful if all our data is measured on the same scale. This can help produce more accurate predictions, and ensure the model doesn’t become biased towards an input with larger values.
Normalisation and Standardisation are the two main methods used for scaling data.
Normalisation is when we want to change the range of the distribution of the data.
Standardisation is when we want to change the shape of the distribution of the data.
Normalisation
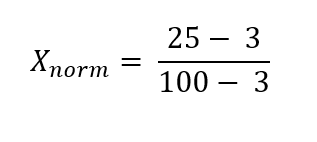
During the process of normalisation, we rescale our data so all data points lie within a common scale- usually between 0-1. The smallest value in our dataset is given a value of 0, and the largest value is given a value of 1, with values in between being distributed between 0 and 1.
Normalisation is especially important when using algorithms which will put a higher importance on larger numbers. For example, clustering algorithms will put the same level of importance on 100 pence as it would £100 without normalisation. If we are using Neural Networks, scaling helps our model to reach a solution faster, and results in a more stable model.
We use the following formula to perform this type of scaling:
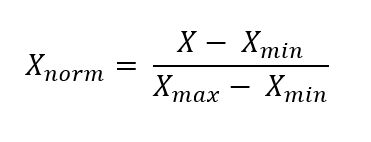
Where X is any value, Xmin is the minimum value in our dataset and Xmax is the largest.
For example, for a dataset containing the values [3,10,6,5,7,15,25,100], the value for 25 would be normalised and would be represented by the new value of 0.23.
Standardisation
Standardisation is another scaling technique where data points are centred around the mean with a standard deviation of 1.
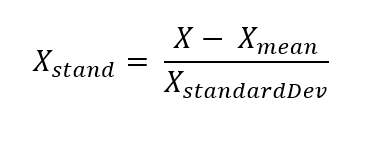
Where X is any value, X mean is the mean of the dataset, and X standardDev is the standard deviation of the dataset.
Because the use of standardisation doesn’t result in data being restricted to a certain range, it is suitable for data which follows a normal distribution.
Example
To show the power of data scaling techniques, we can apply these methods to a dataset which will we use for a predictive algorithm. The aim of the predictive algorithm is to estimate house prices based on variables such as house age, house size, location (latitude and longitude), mean salary in the area and population of the area.
As an example, we will take a look at the house age and location variables.
Plotting the unscaled raw data as a box plot to show the distribution of the data:
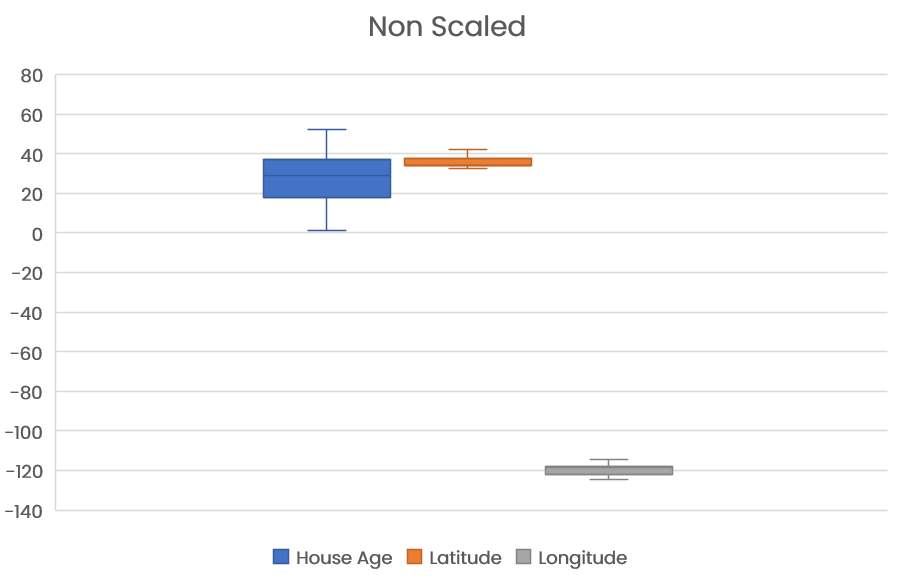
As we can see, the range of the house age variable is 1 to 52 years, whereas the range of location (longitude) is -124 to -114, and range of location (latitude) is 32 to 42.
With such a large difference in the range of our data, our model may not be able to make accurate predictions if we use this data for training the model. Lets look at scaling our data.
Firstly, we can normalise our data, so all our data lies within the range of 0 to 1.
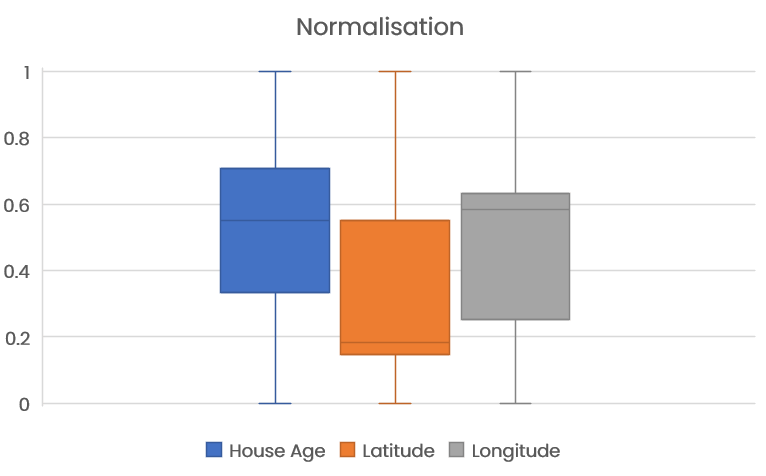
As we can see, by normalising our data, it is a lot easier to compare variables.
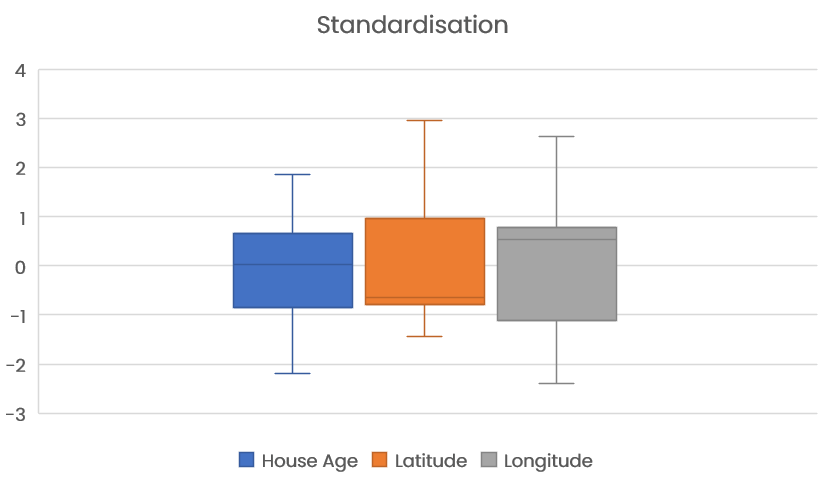
Similarly, we can apply a standardisation algorithm which will centre the data around the mean with a standard deviation of 1.
By applying these scaling techniques, we are able to put our data into perspective, allow our model to learn from the data more easily with the aim of producing predictions with higher accuracy.
Other Scaling techniques also exist, such as Robust Scaling, which is commonly used when we have datasets which contain outliers. This scaler will look at the middle range of the data where statistically most data points exist, therefore excluding the influence of outliers.
Finding the best scaling method will depend upon the application of your model and the type of data you have. When in doubt, trialling a few scaling methods and determining their impact on the accuracy of the models outcome is a good place to start.
To find out more about data scaling and how we can help assist on your data journey, contact hello@harksys.com.