

This allows for a fair assessment of the impact of efficiency projects. Energy Baselines are a commonly used tool by energy professionals and a necessary requirement for ISO 50001 certification.
Using Energy Baselines
EnBs provide a quantitative reference to a specified period of time. Energy managers select a baseline period (before) and a reporting period (after) for comparisons. Generally, these periods are one year long, as this accounts for yearly seasonality patterns such as weather or production volumes.
For example, consider a factory making widgets. You can see the factory’s energy consumption, in kWh, on the plot below; more efficient heating controls were installed in September 2018:
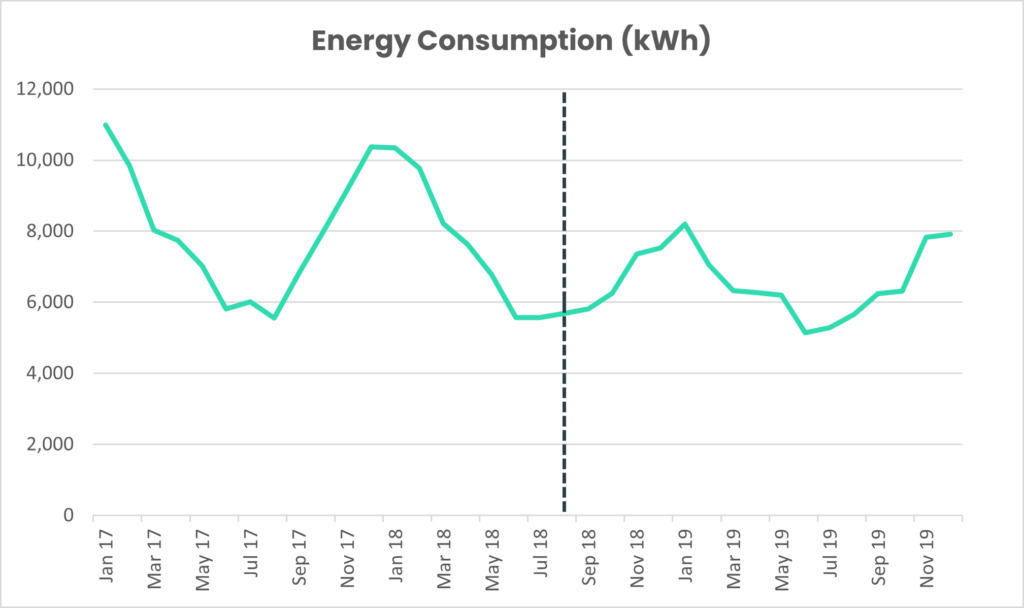
Comparing energy efficiency immediately before and after implementation, you can see a slight drop, followed by a rise to a higher level of consumption than pre installation. If we were doing this assessment in January 2019 without access to a full reporting interval worth of data to compare against the baseline, the outlook may seem quite bleak!
This is where EnBs show their worth. The process of defining a baseline encourages energy managers to give thought to influencing factors and provides a long enough time period for reliable analysis.
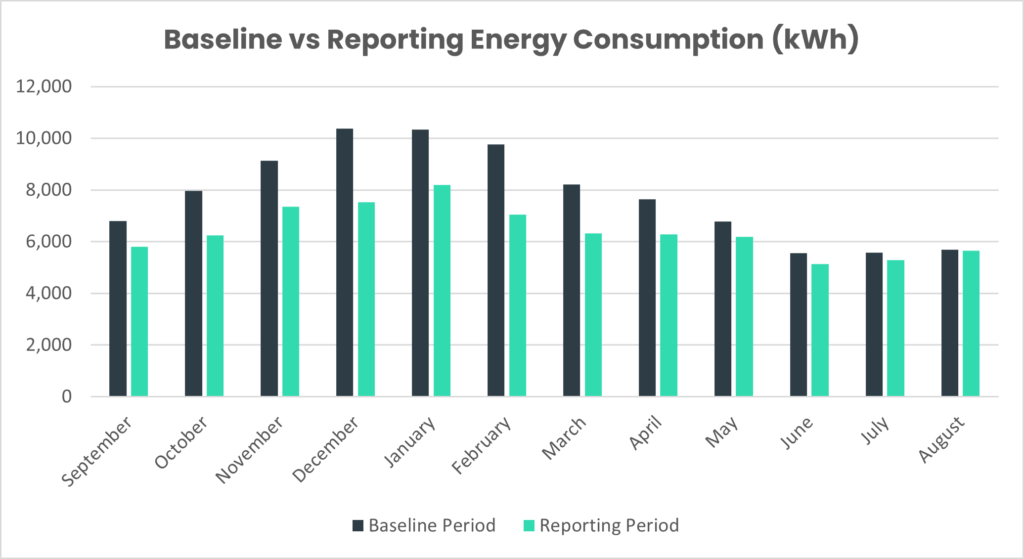
Selecting our baseline period as 12 months prior to installation (September ’17 to August ’18) and our reporting period as 12 months post installation (September ’18 to August ’19) gives a much better reflection of actual savings. The total consumption of baseline vs reporting shows over a 30% decrease in consumption! We can also assess this on a month-by-month basis, for a more granular assessment.
These results are understandable, given that it is a heating project and temperatures cycle throughout the year. However, real-world projects are not always so easy to interpret. Consider how the above analysis would look if the factory’s production doubled from October onwards. We could see an increase in energy consumption, despite an improved heating system.
How Energy Performance Indicators and Energy Baselines work together
For more complex situations, we can use Energy Performance Indicators (EnPI) with Energy Baselines. They work well together, providing multiple benefits:
- Normalising by seasonal variables (temperature, public holidays) allows us to select a shorter baseline and reporting period.
- Normalising by non-seasonal variables (production, sales) allows us to ensure differences in consumption are not down to a change in circumstance.
- Normalising by site-dependent variables (factory size, product produced) allows us to compare results from different sites fairly.
It is possible to normalise by multiple different metrics at once. This ensures your energy consumption is within the expected range, given the weather, time of day, production, and factory size.
Energy Baselines are used by leading energy professionals, providing a useful addition to the toolbox of anyone looking to improve their energy efficiency.
These Baselines form part of the requirements for achieving the ISO 50001 certification. Baselines must demonstrate an improvement in energy efficiency and include any factors that significantly affect consumption.
To learn more, or see how we use Energy Baselines, get in touch at hello@harksys.com.