At present, businesses are experiencing massive increases in energy costs and there is pressure on the government to help support those who cannot afford to pay. One thing that absolutely must change, in order for a practical, sustainable and affordable future, is how businesses measure the consumption of energy. In our view whilst support form the government is commendable it doesn’t offer the full solution, or address the longer-term challenge.
Our unified goal needs to be to end overconsumption – this is the way to a truly net-zero economy. Increased data enables things like forecasting – too many businesses are hostage to their single meter reading for their bill at the end of the month and don’t have enough insight into their day-to-day operations. IoT enables the retrieval of what is currently ‘dark data’, with this data businesses can make more intelligent decisions about their operations.
The reality of IoT deployments
For some, there’s a stigma with IoT and not so much awareness around what an IoT deployment looks like, or how easy it is to pull off. People are put-off by thoughts about huge deployments requiring giant budgets, that take years to pull off. This perpetuates the myth that ‘in order to reduce costs, you’ll need a large-scale IoT deployment,’ and can scare people away from IoT. The truth is it doesn’t need to be and like most transformative projects the stages and the planning are key to its success. Yes, it’s true that marginal gains are more attractive when pieced together at scale but there are still small advantages to take hold of with micro deployments – one store, one restaurant in order to test theories on increased data capture.
What we must understand is that there’s no “one size fits all” approach to a business’s energy consumption or IoT rollout, because the nature of having a business means having a different mix of methods, processes, technology, and machinery than other competing businesses. IoT connectivity work needs to blend into those niche processes and idiosyncrasies in order to adequately grasp the efficiencies on offer and to also enable it to become part of the every day for the wider business. Saving energy isn’t a one-stop journey, it’s a series of continuous journeys by many stakeholders.
What can energy monitoring really do to reduce costs?
Data is the first step to making impactful decisions regarding your energy consumption. In other words, if you don’t know what’s broken, how you gon’ fix it?! Seeing where energy is being over-consumed or unnecessarily consumed is a great starting position, it lets you say things like:
“Why is this particular CNC machine using so much more energy than the others?”
“All of the lights in this store are still consuming energy overnight, who is responsible for them?”
“There are spikes in consumption for a certain asset group during certain hours, what is causing this?”
Being able to see these anomalies, means being able to investigate and fix them. This is how you start to reduce energy costs.
Finally, with an energy monitoring system like The Hark Platform, you can set up triggers, automations, and alerts. This enables 24/7 peak performance so not a drop of that sweet, sweet power is wasted.
Is there a ‘one-size-fits-all IoT gateway for all deployments?
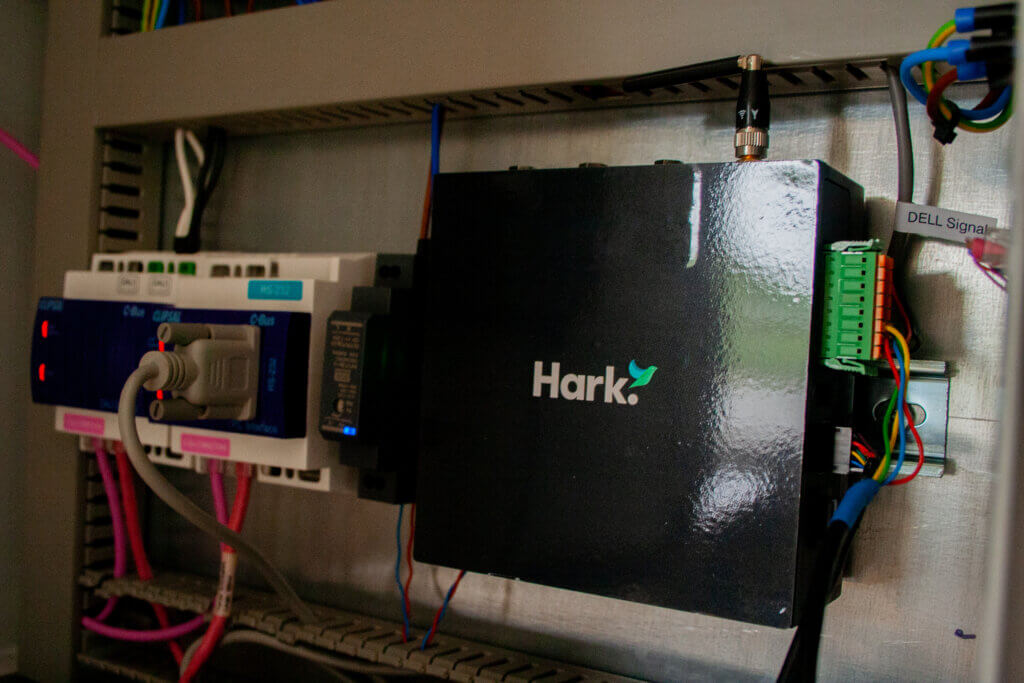
An IoT gateway or a Hark gateway, as we call them here, looks a little like the picture below.

In context, it works like this:
If you aren’t sure, you can read about exactly what a Hark Gateway is here.
In our view, there isn’t a one-size-fits-all gateway for every business, building or deployment. Specific gateways will or won’t be suitable to the environment, or the network architecture that may be required or decided upon. As a rule of thumb, Hark advise only installing additional hardware if absolutely necessary. After all, if we can, we should avoid installing yet another box on the wall. If a gateway is required, then our approach is to ensure that it can be customised and ‘ebb and flow’ to the requirements of the building/site/business.
How flexible dashboards help make energy-saving an everyday thing
There are multiple products that form The Hark Platform (Hark Connect, Hark Analytics and Hark Meter Readings being the core products). Each of these has its own dashboarding capabilities and therefore enables you to get a deeper understanding of your energy use.
An IoT dashboard allows you to select widgets that show you what you want to see: data from specific assets or meters, holistic data from an entire building, or even all of your buildings.
At its root, an IoT dashboard is the way your data is visualised in order for you to make perfect sense of it and easily see any issues.
Not many people have the same view of how their business runs – the assets an individual uses will differ from shop floor, to finance, to energy, to maintenance and therefore the view and information requirements for stakeholders are different.
Any IoT platform worth its salt should allow users to create views of their data, that is the most relevant to them. Energy performance isn’t just one person’s job and this kind of technology helps to promote that idea and ultimately enables stakeholders within an organisation to collectively make a difference.
How to start optimising energy use with intuitive IoT platform features
Okay, now the part you came for…
Once you’ve got an idea of which assets you need to monitor (if you don’t already know this, Hark can send out a team to investigate your energy estate and make a decision based on where we think you’ll see the best results) and a subscription to an IoT platform, you’re ready to start making changes that positively impact your energy performance.
Once you’re logged in, you’ll need to get connectivity to your assets. No need to worry, if you’re using The Hark Platform, you can follow our simple guides either on the platform itself or by heading to harksys.com/docs. Once connectivity to the platform is achieved it’s time to set up a dashboard that works for you.
Now you have the freedom to decide what information you’d like to see, based on what Hark’s vast widget library has to offer. Once you’ve added your widgets to create your custom dashboard (or launched a quick start dashboard if you want to get started faster), you’re set to go. You can then set up Energy Hierarchies to help organise your energy data, and begin monitoring and reporting on energy performance. Later, you can implement triggers, alerts, and automations to fully optimise your estate.
And then you can say, hooray! You’ve got crystal clear visibility of your energy data, now go look for anomalies or potential issues and get them mended! You’ve just started your journey, and you’re able to take control of your business’ energy consumption and cost.


